


By Jon Lechte, CEO Income Asset Management
There’s a lot of noise in markets at the moment. Geopolitical tensions, the inflationary overhang of the Iran conflict, central banks navigating an unusually complex path. For fixed income investors, it can feel like there are too many variables to act with conviction.
But sometimes the best antidote to short-term noise is long-term perspective. And when you look at 20 years of Australian bond and credit data, a reasonably clear picture emerges — one that I think has direct implications for how investors should be positioning their fixed income portfolios right now.
Where Rates Actually Are — In Historical Context
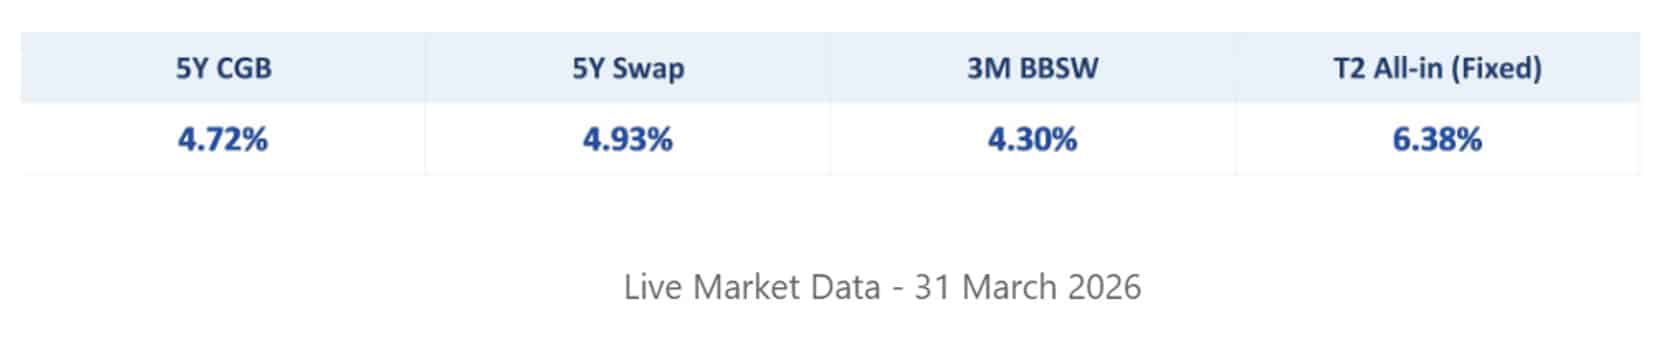
The 5-year Commonwealth Government Bond is currently yielding around 4.72%. Major bank subordinated (Tier 2) debt in the commonly issued 10-year callable-at-5 structure is offering all-in yields of approximately 6.38% for fixed-rate issuance, with the 5-year swap at 4.93% and T2 credit spreads running around swap plus 145 basis points. On a floating rate basis, with 3-month BBSW at 4.30%, equivalent paper is yielding approximately 5.75%.
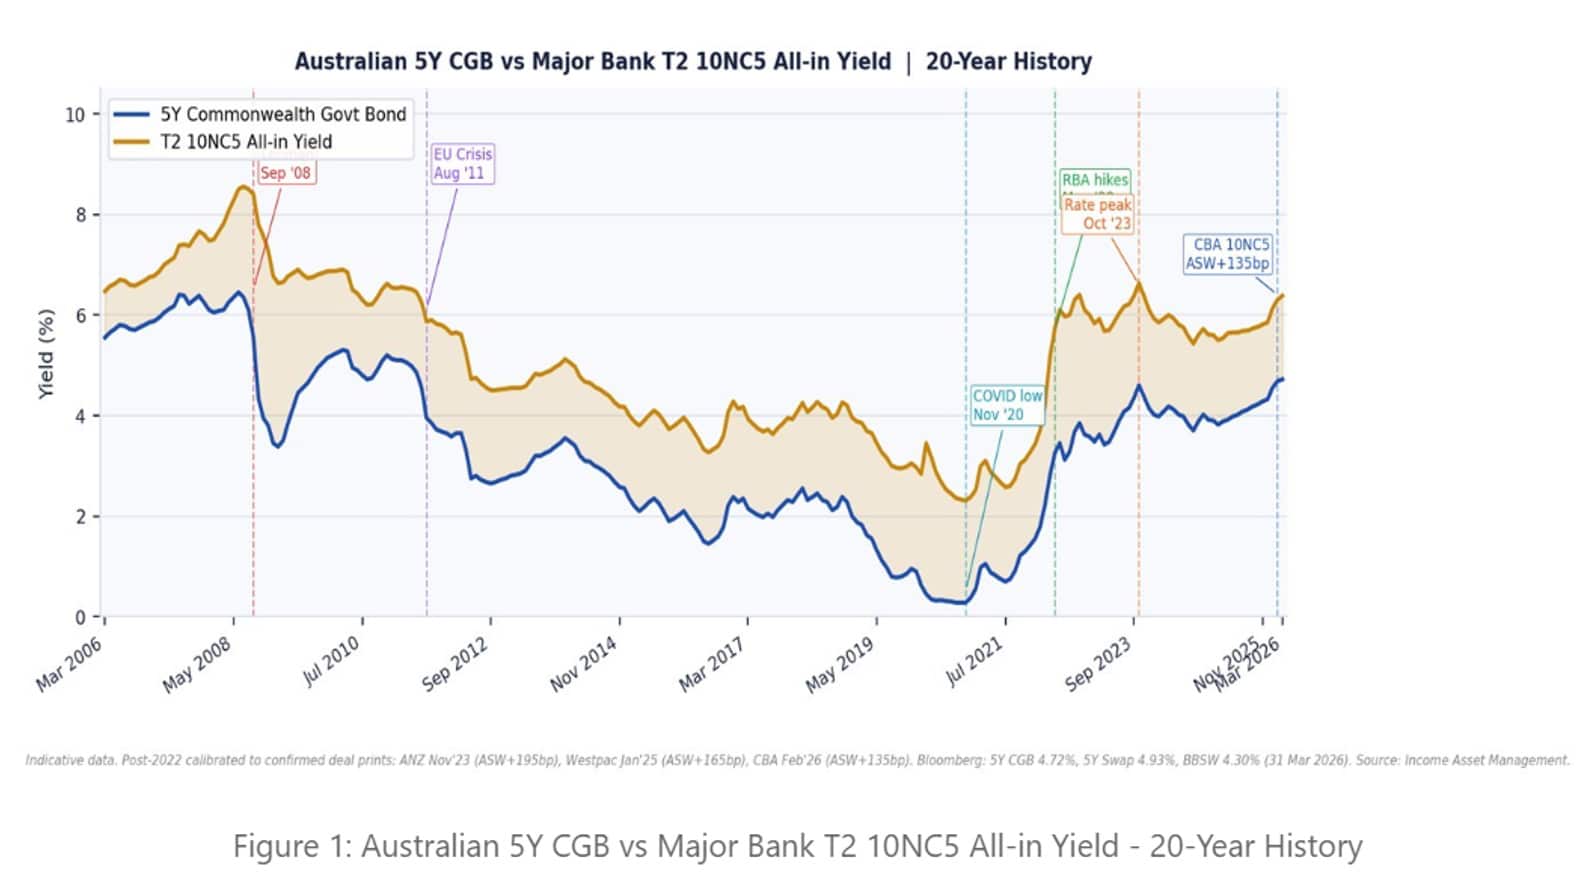
These are not low numbers. In fact, when you plot them against the last two decades, we are sitting comfortably toward the upper end of the historical range. The only sustained period where CGB yields were higher was the pre-GFC era, when the 5-year bond was trading above 5.50% and ultimately peaked near 6.45% in mid-2008 when the rate environment was driven by a fundamentally different inflation regime and global growth backdrop. Outside of that window, today’s yield environment is as attractive as Australian fixed income investors have seen in a generation.
The COVID low of 0.28% on the 5-year CGB feels distant now, but it was only four years ago. The round trip from 0.28% to today’s 4.72% is a stark reminder of how much the opportunity set has changed.
The Spread Story: Australian Banks Are Priced for Comfort, Not Crisis
Beyond the risk-free rate, it’s worth examining where bank credit spreads sit. T2 subordinated debt from the major Australian banks is currently trading at around 165 basis points over the CGB — with the 5-year swap at 4.93% and T2 ASW credit spreads at approximately 145 basis points. That is a long way from the crisis peaks of 285 basis points during the 2022 supply surge and the 300 basis points hit at the height of COVID.
The current spread level reflects a market that is pricing Australian bank T2 as genuinely high-quality credit and IAM believes it is fairly valued given the fundamental strength of the institutions behind it.
Part of what distinguishes the Australian T2 spread from comparable offshore markets is the credit rating underpinning it. Australian major bank T2 subordinated debt carries investment grade ratings of A-/A3/A- (S&P/Moody’s/Fitch) — a full rating category above the BBB range where US bank subordinated debt typically sits. That rating differential directly reflects the superior capital position and regulatory framework of the Australian major banks and is explicitly priced into the spread: tighter spreads here are not a function of investor complacency but of demonstrably lower default risk.
Australian Banks Are Not the Banks of 2008
One of the most important developments of the past 15 years is something that doesn’t make headlines precisely because it’s working as designed: the dramatic improvement in Australian bank capital buffers.
In the lead-up to the GFC, the major Australian banks operated with Common Equity Tier 1 (CET1) ratios in the range of 7–8%. Today, those same banks carry CET1 ratios of approximately 12–13% capital, that acts as the first and deepest line of loss absorption before any subordinated noteholder is at risk.
APRA’s “unquestionably strong” capital framework, introduced following the GFC and progressively strengthened through the Murray Financial System Inquiry recommendations, has fundamentally changed the risk profile of Australian major bank capital instruments. Liquidity Coverage Ratios and Net Stable Funding Ratios are well above regulatory minimums. The loss-absorbing capital framework governing T2 instruments is clearer and better understood by the market than at any point in history.
The structural improvement in bank capital took another defining step in September 2024, when APRA confirmed the phased elimination of Additional Tier 1 (AT1) capital instruments — the bank hybrid securities that retail investors have held in the form of CBA PERLS, NAB Capital Notes, Westpac Capital Notes, and their equivalents from the regulatory capital frameworks of Australian authorised deposit-taking institutions. The phase-out commences 1 January 2027 and runs through to January 2032, by which point AT1 will no longer count toward regulatory capital for any APRA-regulated bank.
APRA’s decision was catalysed in part by the experience of Credit Suisse in March 2023, where AT1 instruments were written down ahead of equity in a manner that surprised markets and exposed the complexity of AT1 trigger mechanisms under stress. Australian regulators drew their own conclusions: if the loss-absorption sequencing of AT1 is unclear to markets under stress, the instrument is not performing its regulatory function with sufficient certainty.
Under the replacement framework, the approximately A$40 billion of AT1 outstanding across the major banks will be wound down as instruments reach their first call dates. Roughly 75% of that capital will be replaced by additional Tier 2 issuance, with the remaining 25% absorbed into CET1 equity. For the major banks, this implies a material and sustained uplift in T2 issuance over the transition window — the sector will need to bring significantly more subordinated debt to market than historical run-rate volumes would suggest.
The implications for T2 investors cut both ways. On the positive side, the CET1 buffer that stands ahead of T2 holders deepens further as banks build toward the new capital targets, reinforcing the already-strong loss-absorption cushion underpinning T2 credit quality. The capital stack becomes simpler, better understood, and less dependent on instruments whose behaviour under stress was, as Credit Suisse demonstrated, unpredictable. On the supply side, the structural increase in T2 issuance is a factor to watch while the market has absorbed early AT1 replacement tranches with limited spread disruption, the peak issuance years of 2027–2030 will test the depth of investor demand. To date, that depth has been considerable — but it bears monitoring.
“The phasing out of AT1 hybrids deepens the CET1 cushion above T2 holders and simplifies the capital stack — credit positive for T2 investors, even as it brings additional supply to the market.”
The T2 credit spread of 165bps over CGB today compares favourably to the 185–188bps that prevailed through 2015–2016 — not because investors are complacent, but because the underlying institutions are demonstrably stronger. That spread compression is the market’s verdict on Australian bank credit quality.
A Practical Allocation Framework
So, invest fixed rate or floating rate? I’d argue a barbell approach is appropriate for most investors.
For those who believe that we are at or near the top of the rate cycle, locking in current fixed rate yields looks attractive. A 5-year CGB at 4.72%, or a major bank T2 instrument at ~6.38% all-in fixed, represents investment income that could not be accessed for the better part of a decade.
But geopolitical risk is real. The inflationary impulse from the Iran conflict has not fully washed through supply chains, and there remains a scenario where rates push higher from here before they settle. For that reason, despite the appealing yield pick-up over floating rate, I would not recommend going fully fixed.
My view: depending on your personal view on rates – hold 40–60% of your fixed income allocation in floating rate instruments for now. If yields push higher, your income rises with them. The fixed portion locks in today’s historically attractive rates. The floating portion keeps you flexible.
Floating rate securities give you rate optionality. Note that at current BBSW of 4.30% versus a 5-year swap of 4.93%, there is a 63 basis point premium to fixing. This is an unusually wide gap and is your cost of optionality: locking in fixed yields today comes at a meaningful price relative to floating rate equivalents, which warrants a considered rather than wholesale shift to fixed.
There is also a technical case supporting Australian duration. The spread between 10-year Australian government bond yields and US Treasury yields has widened to approximately 70 basis points and the recent underperformance of Australian yields relative to their US counterparts looks somewhat overdone on a historical basis. Australian 10-year yields have a well-established tendency to follow the direction of US Treasury yields over time, rarely sustaining prolonged divergence from global benchmarks. While trend pendulums always tend to test investor’s nerves, this dynamic provides a meaningful tailwind for the fixed component of a barbell portfolio and supports holding at least 40% in fixed rate instruments, even for investors who remain cautious about the near-term domestic rate outlook.
The Bottom Line
Twenty years of data puts today’s yield environment in plain sight: we are near the upper end of the historical range for Australian fixed income. That doesn’t mean rates can’t go higher but it means that for patient, income-oriented investors, the case for meaningful fixed income allocation is stronger now than it has been for most of the past decade.
Australian banks are better capitalised, better regulated, and better understood by capital markets than they were during any previous period of spread stress. The APRA-driven evolution of their capital structures, including the ongoing phase-out of AT1 in favour of higher-quality CET1 and T2, and the resultant deepening of CET1 buffers, further reinforces the investment case for subordinated bank paper. For investors seeking yield without reaching into genuinely speculative territory, quality bank paper (fixed and floating) remains one of the more sensible places to be.
The noise will continue. The data, on the other hand, is fairly clear.
The above reflects personal views and is intended as general market commentary only. It does not constitute financial advice. Past performance and historical ranges are not a guarantee of future outcomes. Investors should seek advice appropriate to their individual circumstances.


")


 Platform To Digitally Trade Corporate Bonds")