


Concocting a bearish view on US stocks based on valuations is relatively easy. It doesn’t mean the market is going to correct. Current inflation rates and US companies’ high profit margins can keep the bull market going, but change any of the assumptions on nominal growth, long-term bond yields or equity multiples and it becomes a different story. The macroeconomic outlook remains key and there is just not enough weight of evidence to turn sentiment sour despite the long list of potential risk factors. But the S&P 500’s fresh high means new highs in price-to-earnings (PE) multiples. Long-term investors should ignore that at their peril.
- I still like short duration credit, inflation-linked bonds and high yield.
- I’m worried about US equities, Federal Reserve (Fed) interference, European fiscal trends.
Rich to cheap
Applying all the usual caveats about data quality and methodology, the core concern over US equity valuations is that, historically, when the market has traded at a similar PE ratio, as it does today, subsequent total returns over the following decade have been close to zero (on an annualised basis). Valuations matter less for short-term investment horizons, but long-term returns are affected by the valuation starting point. History also suggests US equity returns underperform returns from the US Treasury market if the starting point is like today’s valuations. The chart below uses data from Refinitiv DataStream (DS) going back to the early 1970s, plotting the starting PE ratio against the subsequent annualised 10-year total return. On this data set, the PE today is 28.7.
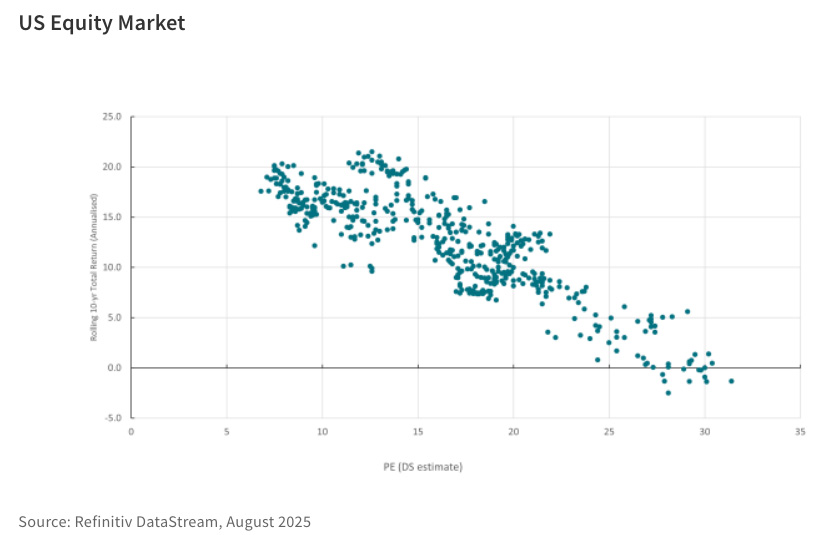
UK and European market analysis shows a similar linear relationship. Currently, for the UK, the 10-year expectation would be total returns of between 3% and 10%, and for Europe 5% to 10%.
Largely earnings
Most current price-based valuation measures put the US equity market close to historical highs; price-to-book for the S&P 500 is above five times, a similar level to where the market was at the height of the dot.com boom in 2000. If we assume valuation multiples can’t go much higher (maybe wrongly, time will tell), then it is the denominator we need to focus on. If the PE ratio is close to peaking, then future total returns will depend largely on earnings growth. The current Institutional Brokers’ Estimate System (IBES) 12-month forward consensus forecast for earnings-per-share growth for the S&P 500 is 12.3%. Clearly, if the US does experience slower growth and a recession in the next couple of years, earnings growth will deteriorate, and equity returns will be lower. That is why US employment data, and an assessment of what the material damage from US tariffs could be, are so important. But for now, investors seem confident that US companies can continue to deliver earnings growth, and this will sustain double digit total returns. Growth stocks continue to outperform value.
Boosted by price increases
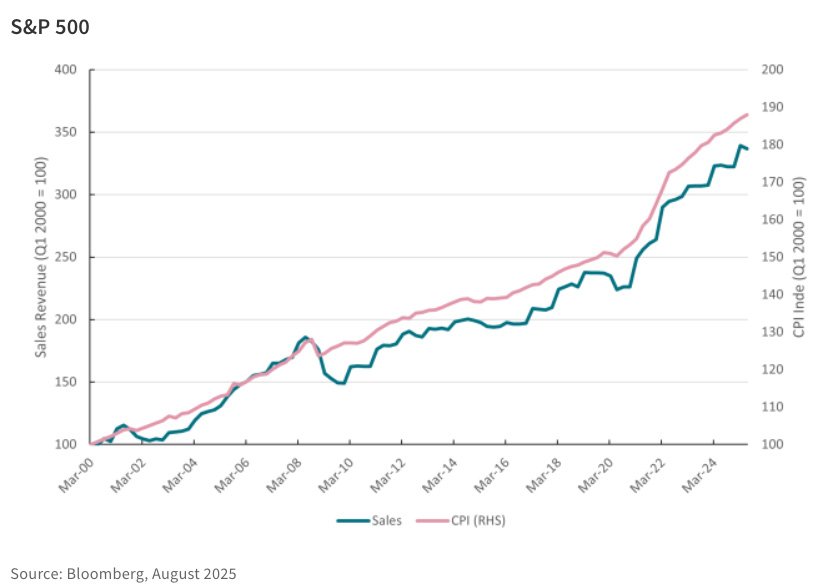
We should think about the relationship between inflation and corporate earnings. Over time, inflation allows companies to raise prices and thus boost nominal revenue growth. There has been a near to 70% correlation between annual changes in the US consumer price index (CPI) and the aggregate sales dollar value of S&P 500 companies. Since 2020, inflation has been higher and so has nominal revenue growth. In the five years between the second quarter (Q2) of 2020 and Q2 2025, inflation totalled 25.1% and nominal revenue growth for the S&P 500 was 50.5%. In the five years before Q2 2020, the growth rates were 8.2% and 15.1%. Obviously, the last five years have seen an explosion in technology company revenues because of the onset of generative artificial intelligence (AI) and the Information Technology sector has delivered 40% nominal revenue growth since Q2 2020. However, higher inflation has contributed to higher aggregate nominal revenues, and thus earnings per share.
Also read: Navigating Through Uncertainty in the Global Fixed Income Market
If we adjust S&P 500 earnings-per-share data for inflation since the end of 2020, the adjusted price-earnings ratio would be 30 times rather than 24.5 (Bloomberg estimate), based on the S&P 500 closing level of 26 August. Stated differently, a 24.5 multiple on inflation adjusted earnings would give an index level of 5,272 (almost 20% lower than the actual index level).
No guarantee of correction
I don’t know what inflation will average over the next five years, nor what will happen to earnings. AI could sustain very strong earnings growth for years, which is what the long-term bullish argument for US equities rests on. Yet, if inflation is higher, bond yields will be higher and thus the equity multiple should be lower (which is what happened in 2022). The key point is that US equities are trading on historically high multiples, after five years of very strong earnings growth and inflation above what has been seen as acceptable by the Fed. And the historical return track record suggests that at these levels of valuation, it is hard to sustain a similar level of total returns over the medium term.
Global allocations
A modestly higher inflation regime in the US coupled with technology-driven real earnings growth should not be a problem for investors. Equity returns should outperform bonds and returns from other global markets. A marked move lower in multiples is hard to predict other than taking the cue from historical patterns. It would need a recession, or a fiscal shock, or policy and political uncertainty of a higher magnitude to what we have today. But there is an argument for global equity diversification away from the US to markets where valuations are lower, and the inflation outlook makes nominal revenue expectations more stable – perfect for deriving stable dividend income. Again, another argument for having more European and Asia exposure, and less US, especially for long-term focussed investors.
Credit
This is important for credit as well. There is a close relationship between credit spreads and the equity earnings yield (the inverse of the PE). A lower equity multiple/higher earnings yield has a positive correlation with wider credit spreads. It’s alright talking bearish, but what could the catalyst be? The list is long – tariff-induced slowdown; bond market crisis; private credit implosion; collapse of confidence in US institutions; and US dollar weakness – but none of these are new and there is no way of knowing when, and if, any of these spurs on a panic sell. Sentiment remains too strong for that.
Bonds are alright
There is bearishness around government bonds but even that has not spilled over into equities or, indeed, into credit sectors. Renewed political uncertainty in France – driven by fiscal issues – has pushed French bond yields higher. The UK market continues to be in the firing line ahead of more clarity on what the government there will do to try and improve the fiscal outlook. But I continue to insist there is no bond crisis. Steeper yield curves reflect stronger nominal GDP growth than expected, together with the assumption that central banks in the US and UK will reduce interest rates further. Risk premiums have risen but long-term yields are not far from what medium-term trends in nominal GDP growth would suggest. Obviously, the equity market has provided higher total returns, with a wild ride, but a passive investment in market cap-weighted government bond indices would have delivered total returns of 4.6% in the US, 1.2% in the UK, and would have been flat in European government bonds (but 2% in Italy). Stay calm and clip the coupon.
Performance data/data sources: LSEG Workspace DataStream, ICE Data Services, Bloomberg, AXA IM, as of 28 August 2025, unless otherwise stated). Past performance should not be seen as a guide to future returns.


 Platform To Digitally Trade Corporate Bonds")


