


 Asset Allocation Falls Out Of Fashion")
By Benoit Anne, Director, Investment Solutions Group, MFS Investment Management
Summary: Investors have preferred equities relative to fixed income for the last few years but the macro backdrop has changed dramatically. Value has been restored in fixed income, compliments of the recent rate correction. This may prompt investors to revisit the fixed income allocation in their multi-asset portfolios.
We are approaching a turning point for asset allocation, with fixed income becoming more attractive. Until recently, the case for equities was overwhelmingly strong, following the TINA narrative. Looking back, we see economic growth was high and rising and domestic demand was particularly robust. But the macro backdrop has changed dramatically.
Inflation has emerged as the predominant macro risk, along with rising recession fears in the context of the US Fed’s hawkish stance. Equity investors appear more and more concerned over slowdown risks and the outlook for earnings. On the fixed income side, we have experienced a spectacular correction in US rates, along with some further weakness in credit spreads. Against this backdrop, we believe the TINA may not be the compelling strategy in future.
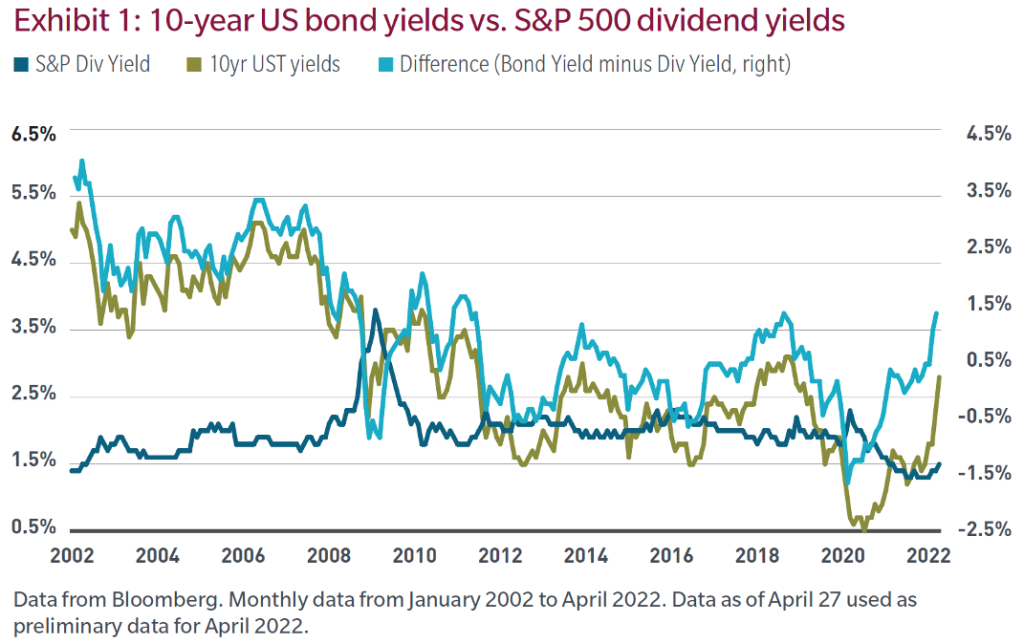
The rate normalization, however brutal it has been, is ultimately helping restore value in fixed income. One of the TINA pillars is that exposure to equities makes sense, even if only from the standpoint of generating stable income through dividends.
The strategy did hold true when bond yields were low. But the strategy is no longer compelling in relative terms, with 10-year US Treasury yields now jumping well above the level of average dividend yields for the S&P 500 (Exhibit 1). The bond yield pickup of 130 basis points above dividend yields is now the highest since 2011.
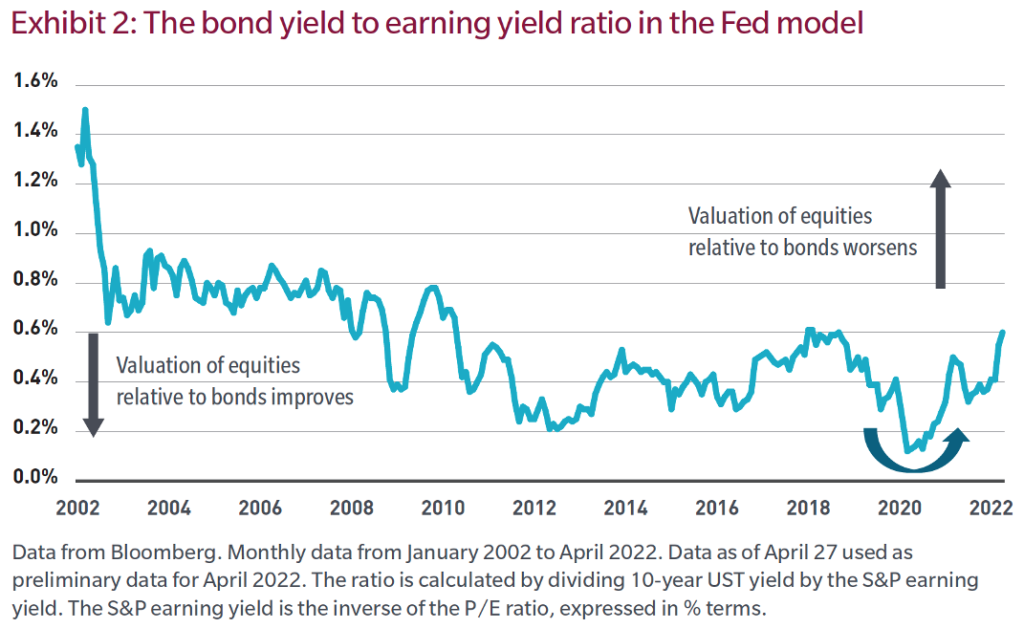
The relative value backdrop between equities and fixed income is now more balanced. While technically equities continue to screen cheap relative to bonds, the equity valuation advantage has worsened markedly over the past few months according to the so-called Fed model, which holds that an S&P 500 earnings yield higher than the 10-year Treasury bond yield is a bullish signal for the equity market.
Conversely, bond yields higher than earnings yields create a negative signal for equities. At about 4.3% for earning yields, the equity signal remains favorable, but the relative value picture has nevertheless deteriorated substantially (Exhibit 2).
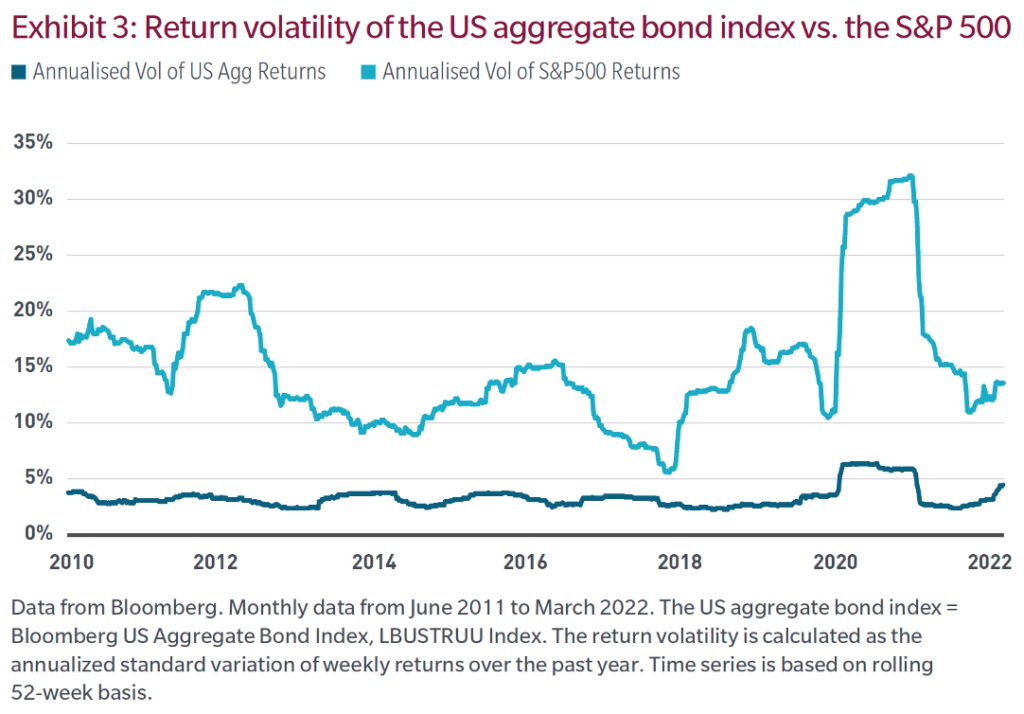
As a volatility management tool, fixed income also plays a key role in a multi-asset portfolio. The volatility of equities has been elevated and is rising, with the VIX well above its long-term average. Return volatility has also risen in fixed income, but it remains considerably lower and more stable (Exhibit 3). Given the historically elevated allocation to equities, the portfolio rebalancing process favoring a higher fixed income allocation would likely help manage portfolio volatility.
Looking ahead, fixed income is likely to become more attractive relative to equities on a risk-adjusted basis. Given the current inflation backdrop, returns adjusted for inflation are bound to look challenging for both equities and bonds until inflation corrects lower.
The market has priced in a significant tightening in the period ahead. At this juncture, the market is positioned for a terminal federal funds rate of about 3.30%, indicating some 280 bps of further tightening (Exhibit 4).
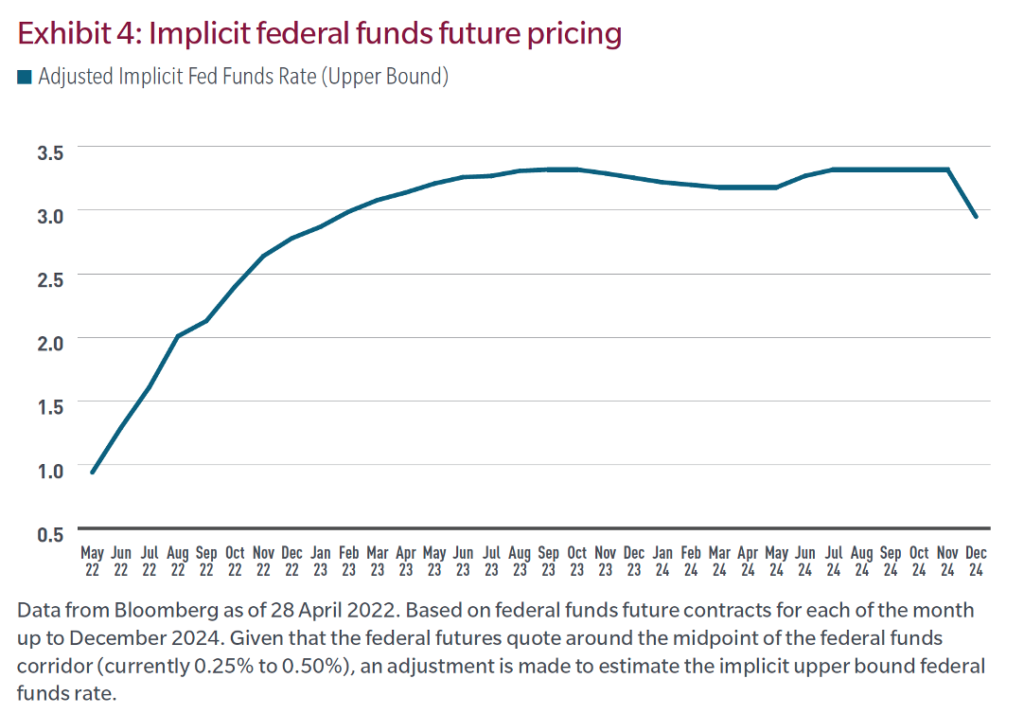
This is more than the Fed’s own guidance, as expressed in the most recent Summary of Economic Projections, published in March. The volatility of rates has been elevated, and the balance of risk is still skewed to the upside for US rates, given the Fed’s commitment to combatting inflation.
Ultimately, a bullish case for long duration (long dated fixed rate bonds) could nonetheless emerge if the hikes are gradually being priced out and we observe an improvement in the inflation backdrop or if the downside risks to growth escalate, prompting the central bank to revisit its inflation-fighting strategy.
Meanwhile, there is attractive value emerging in global fixed income credit after the recent spread correction.
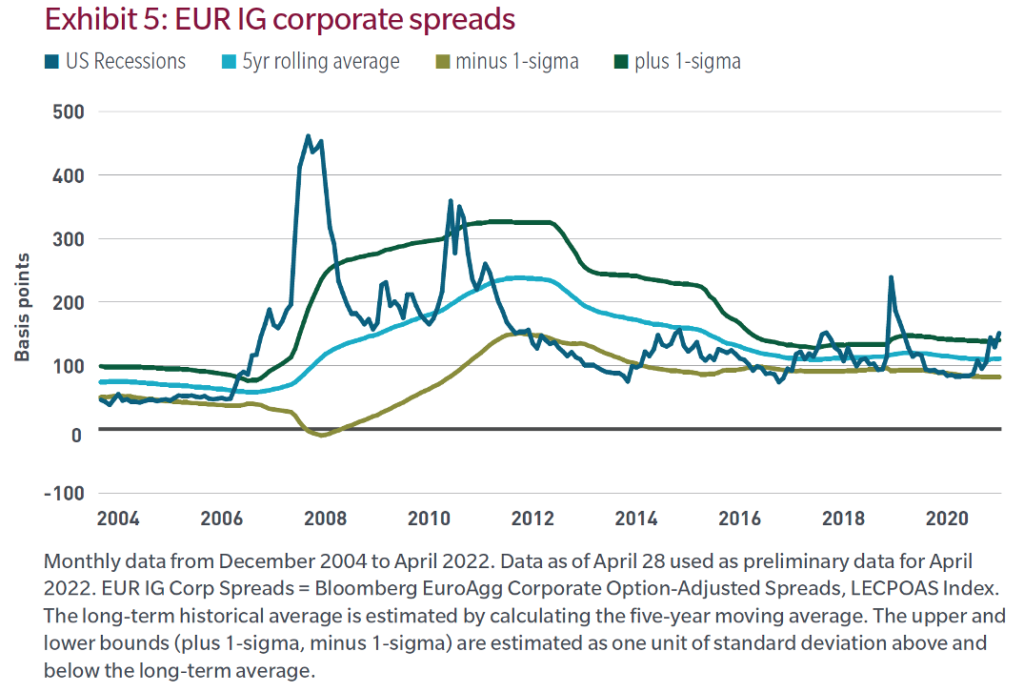
Virtually all spread products have cheapened markedly over the past few months. Two asset classes stand out, however, having corrected to historically attractive levels. These are European investment-grade corporate credit (EUR IG Corp) and emerging market sovereign debt. In particular, European credit currently looks cheap not only for European-based investors but also for US-based investors that would consider hedging their euro exposure, given the negative cost of FX hedging from EUR back to USD.[1] Looking at the recent spread correction, EUR IG corporate spreads now trade close to where they did in December 2018, when investors grew concerned over the rising risk of recession in the face of Fed tightening (Exhibit 5).
In our opinion, from an asset allocation perspective, value is being restored in fixed income through rate normalization and spread correction and there is an alternative to equities. Given the elevated macro volatility, we believe fixed income also makes sense in a multi- asset portfolio from the standpoint of risk-adjusted returns.
")


 Platform To Digitally Trade Corporate Bonds")