


Fixed income May summary by Chamath De Silva, Betshares
- Risk assets have staged a broad relief rally over the past month, with equities buoyed by a relaxation of the US administration’s stance on tariffs.
- Global long-term government bond yields have resumed their climb, driven by improved risk sentiment, a paring back of rate cut pricing and mounting deficit and supply concerns.
- The Australian curve remains captive to global forces, presenting compelling relative value.
If April was about repricing risk, May has been about “repricing the repricing”. The US policy U-turn on tariffs has helped reverse much of the damage, at least in risk assets, buoyed by signs of de-escalation in the trade war and a moderation of recession fears. But as geopolitical and trade tensions have eased, bonds continue behaving badly.
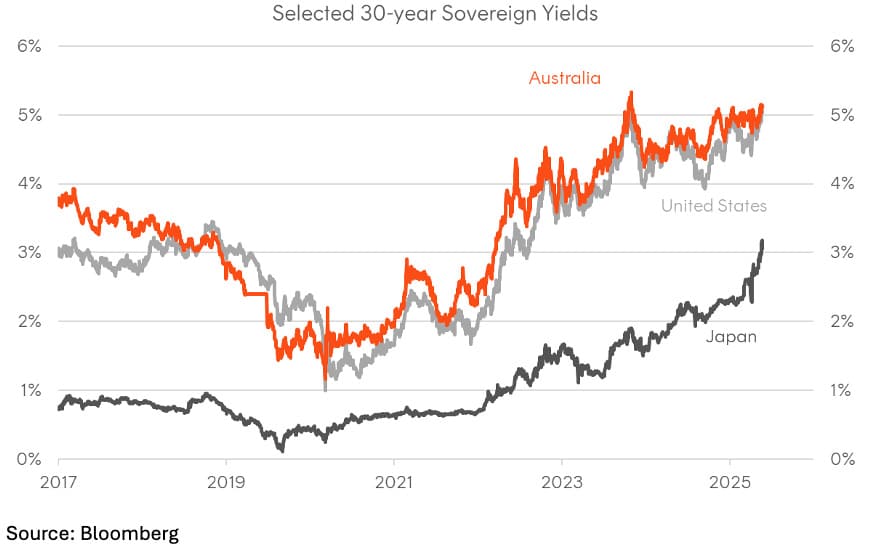
Long-term yields have resumed their climb globally, with the US 10-year Treasury yield back around 4.5%, and the 30-year yield is again above 5%, even surpassing the levels that appeared to force the administration’s initial pivot on trade. Japan’s 30-year yield also recently breached 3%, a level that would have seemed unthinkable not long ago. With US deficit concerns back in focus, inflation risks lingering, and Moody’s now joining S&P and Fitch in stripping the US of its AAA rating, the pressure at the long end continues to build, and is becoming harder to ignore.
Chart 1: Selected 30-year Sovereign Bond Yields
Rates re-rating
Long-term US Treasury yields have continued to push higher, with the 10-year now above 4.5% and the 30-year over 5%. The term premium – defined as the excess yield over expected policy rates – is also trading near cycle highs. Real yields remain elevated as well, with 10-year TIPS holding above 2%. The most obvious catalyst has been the repricing of recession risk.
At the height of April’s trade tensions, markets were pricing in around 100 basis points of Fed cuts by year-end, with July seen as a live meeting. That probability has since been scaled back materially, with only two cuts now priced. The rollback of tariffs has reduced the risk of a self-inflicted recession more than it has eased concerns around inflation persistence.
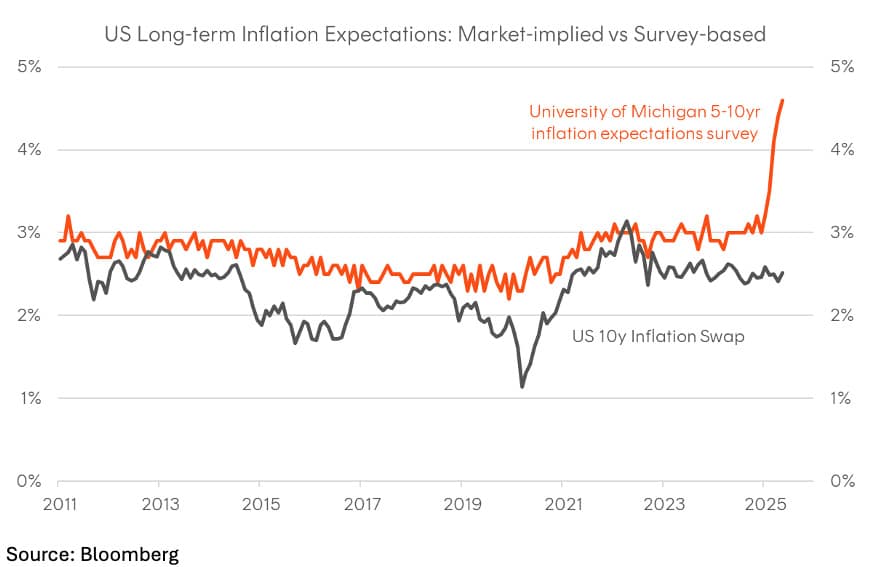
While recent CPI prints have been relatively benign, survey-based measures—such as the University of Michigan’s long-term inflation expectations – have surged to multi-decade highs, reinforcing the Fed’s preference to remain deliberately behind the curve. This stands in contrast to market-implied inflation expectations, which remain well anchored. There is also a behavioural dynamic in play: having been widely seen as behind the curve during the 2021–2022 inflation cycle, the Fed is still working to rebuild its credibility. That combination of firmer growth expectations, inflation uncertainty, and an increased supply outlook has left the long end struggling to find a stable footing.
Perhaps the bigger issue for Treasuries, however, is the apparent U-turn on fiscal consolidation. In the early days of the new administration, Treasury Secretary Bessent had warned that the US was on a collision course with a fiscal crisis and advocated for a “detox” from excessive government spending. Much of that rhetoric has since faded. The latest fiscal bill – centred on fresh, unfunded tax cuts – has only reinforced the perception that the US is on an increasingly unsustainable fiscal path. Moody’s decision to downgrade US sovereign credit was hardly a surprise.
Beyond the US, the other key challenge for Treasuries lies in Japan, where long-end JGB yields, especially in the 30-year and 40-year sector – have risen sharply. Part of this is fundamental, with the Bank of Japan continuing to normalise policy as inflation consolidates above its 2% target. Part of it is technical, with a poorly received 20-year auction adding upward pressure. But some of it appears structural, as the market begins to adjust to a world in which the BoJ is no longer the marginal buyer.
This matters for global bonds because Japan remains the largest holder of USD fixed income and rising JGB yields have reduced the relatively attractiveness of US Treasuries on a JPY-hedged basis. This has led to fresh concerns of major repatriation flows from Japan’s pension funds and insurers.
Whether or not the latest US ratings downgrade or the relatively less attractive US Treasury yields on a FX-hedged basis has longer-term consequences, it adds to the broader “sell America” narrative that has gained traction. The outperformance of European bonds during April’s volatility was consistent with a growing shift in global allocations. While the rotation hasn’t been extreme, there were signs of repatriation flows. Short-dated Swiss government bond yields even dipped back into negative territory. Rather than a one-off, these developments may point to an emerging structural change in how global asset allocators are positioning.
Currency markets have reflected this shift as well. In Asia, the rally in the Taiwanese dollar seems to have been driven not just by improving risk sentiment, but also by a sharp unwind of USD carry trades – particularly from Taiwanese life insurers holding large unhedged positions in US corporate credit. Some have also speculated that pressure from the US administration amid concerns about “currency manipulation” – with Taiwan having been flagged in the past – may have played a role. More broadly, recent FX moves may prove to be a precursor to a deeper reallocation process, as fixed income investors move from adjusting hedging ratios and tactical tilts to rethinking structural strategic asset allocations.
Chart 2: Evolution of Fed expectations (Source: Bloomberg)
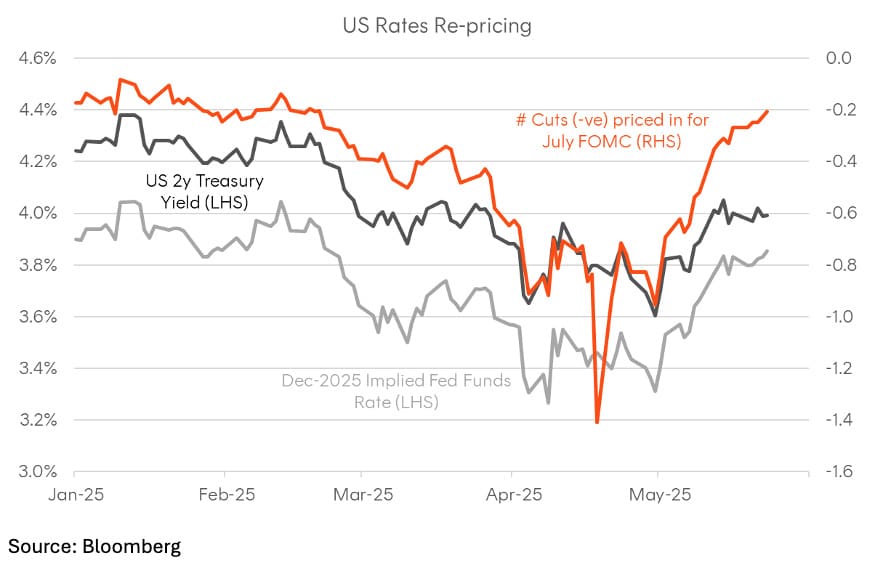
Chart 3: Divergence between survey-based and market-implied inflation expectations
Australian bonds captive to global forces despite the RBA tailwind
Closer to home, the RBA surprised no one in cutting rates in May. What did catch the market off guard was just how dovish the Bank was amid the worsening global backdrop. Not only did the decision statement and press conference skew dovish, but the forecasts in the latest Statement on Monetary Policy involved notable revisions across the key dimensions of activity, employment, wages, and inflation. The RBA already had a green light to move towards “neutral”, which most believe is a cash rate around 3%, but it seems they might now be in a greater hurry to get there.
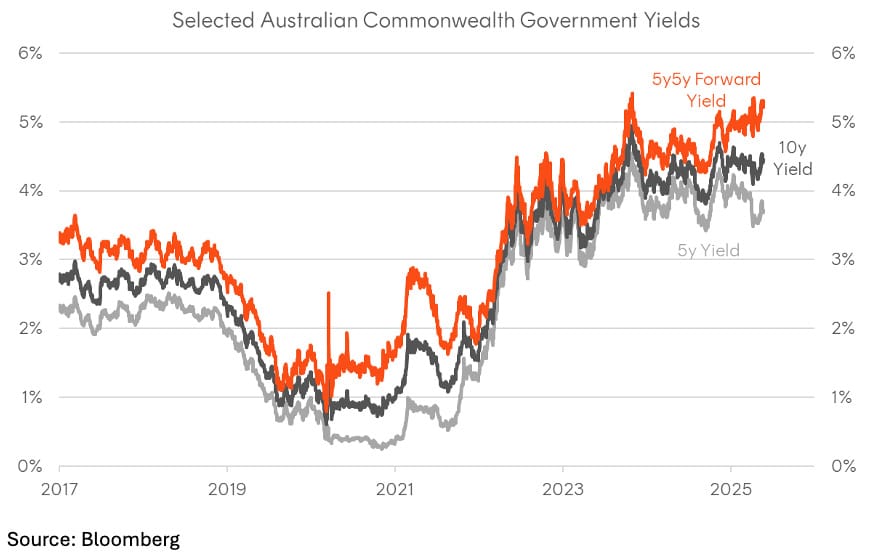
Even so, Australian yields haven’t been spared from the global steepening trend, captive to developments in the US and Japan. The 10-year Commonwealth yield has risen from below 4.1% to 4.5% over the past few weeks and the 30-year yield is back above 5%, despite the RBA tailwind. Implied forward yields – particularly in the 5-10-year segment – are looking quite attractive, embedding a compelling risk premium for taking on interest rate risk.
This repricing across the domestic curve has been driven more by real yields than inflation expectations. Market-implied breakevens remain largely anchored near the lower end of the RBA’s 2-3% target band, while 10-year real yields continue to trade near decade highs – a reminder that high grade bonds still offer attractive real income, even if we don’t get a major disinflationary impulse. That said, any negative shock to global growth from tariffs is likely to have disinflationary spillovers for Australia, given China’s excess capacity still needs to be absorbed somewhere. For those willing to lean against the recent trend in higher global bond yields, there’s probably no better place to do it than at home.
Chart 4: Selected Australian Commonwealth Government Yields
What’s happening in credit?
Credit markets followed the same pattern as other risk assets: an initial gap wider following the reciprocal tariff announcements, followed by a retracement as trade tensions eased. AUD credit largely reflected this global pattern, with corporate and bank spreads unwinding most of the initial move wider.
Conditions did deteriorate notably in the week following 2 April, with signs of liquidity fraying in a manner somewhat reminiscent of the very early days of the pandemic – though unlike then, bids remained accessible, even if bid–offer spreads traded wider than investors would’ve liked. It’s amazing the difference a few weeks (and a few headlines) makes, given conditions are back to normal and it’s almost like that week in April never happened.
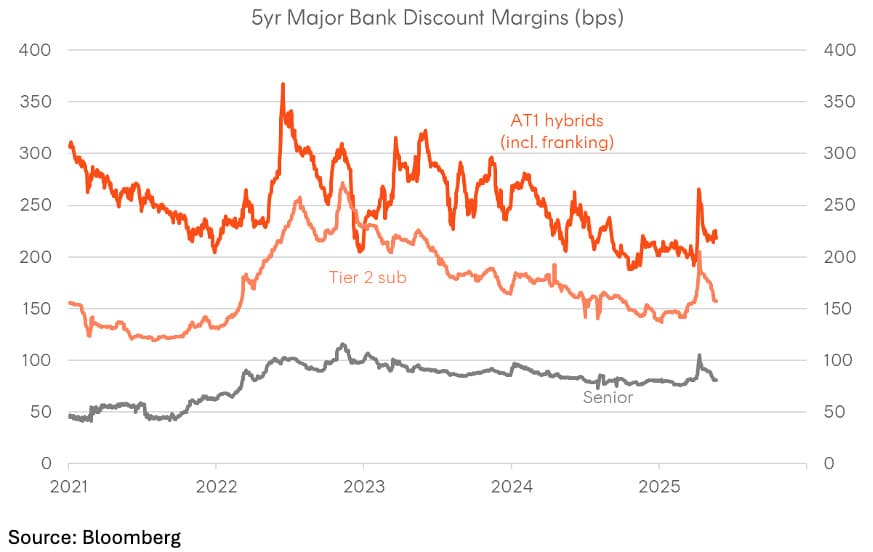
US high yield saw the sharpest widening and has accordingly staged the most aggressive retracement in recent weeks. AUD corporate and bank credit spreads broadly tracked USD investment grade (IG), albeit with the lower beta typical of this market. Within the major bank complex, spreads moved sharply wider across the capital structure, but while senior and Tier 2 debt have almost fully retraced to pre-Liberation Day levels, hybrid discount margins appear to have stabilised at somewhat wider levels.
My own view is that credit spreads aren’t a reliable leading indicator of the business cycle. Spreads tend to blow out when the damage is already underway or from a surge in equity or rates volatility – not before it begins. If anything, we find the internals of the US equity market (e.g. cyclicals vs defensives) offer a timelier read on macro conditions.
Credit spreads are more useful as a gauge of broader financial conditions and liquidity. On that front, the picture remains benign: funding markets are functioning smoothly, issuance windows have reopened, and demand for IG credit – particularly longer-dated fixed rate paper offering compelling yields and attractive rolldown – remains healthy. That dynamic may shift as we approach the first major refinancing cycle of the post-pandemic era, which begins in earnest from 2026. For now, spreads probably won’t tell us much we don’t already know.
Chart 5: Selected Credit Spreads and changes, as at 23-May-2025
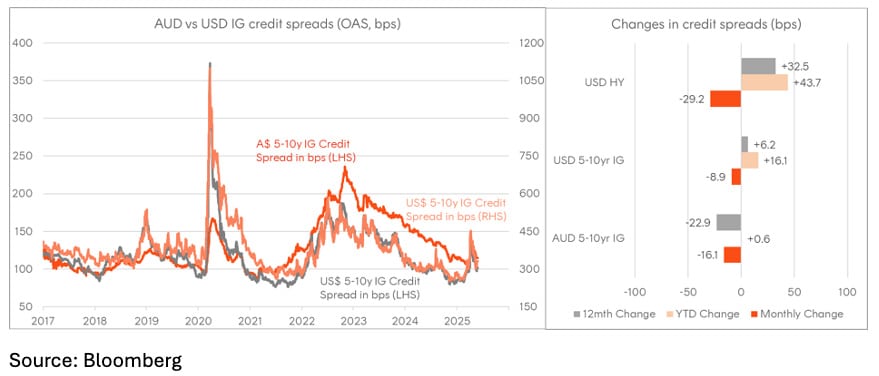
Chart 6: Australian Major Bank Credit Spreads, as at 23-May-2025
Are bond yields the next risk for stocks?
At the time of writing, markets have moved quickly to price out the worst-case scenarios. With the trade war narrative dialled back and the US administration appearing sensitive to market stress, risk assets have staged a strong recovery. The equity market quickly recalibrated to treating the trade crisis as largely manufactured and therefore easily reversed, a view that’s been vindicated so far.
Whether that confidence proves durable remains to be seen. While the outlook is arguably not as bleak as it appeared six weeks ago, there’s still plenty of uncertainty around both the trajectory of the US economy which was already slowing prior to April, and the implications on corporate profits of a less frictionless global trading system.
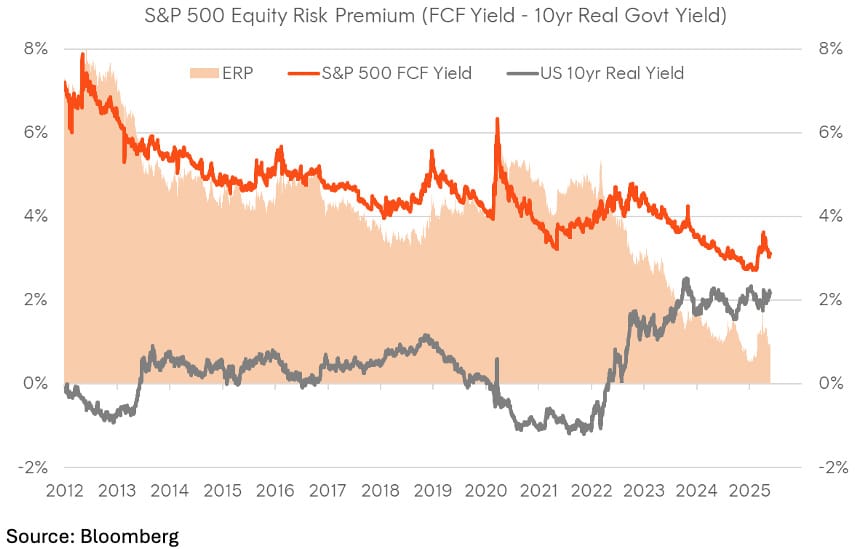
The equity risk premium is once again poor by most measures, and while “goldilocks” might be back, the fundamentals remain cloudy. The 30-year Treasury yield back above 5% is also a potential warning sign. A decisive break higher and a similar move in “10s” could begin to pressure valuations again, particularly considering the modest earnings revisions we’ve seen so far this year. Relief has taken over from panic, but conviction remains limited.
Chart 7: US Equity Risk Premium – S&P 500 Free cashflow yield v 10yr real TIPS yield


")


 Platform To Digitally Trade Corporate Bonds")


 at Western Asset Management")