


 Dropped?")
I recently had an email from Jeff, asking why the value in the iShares Inflation Linked Bond ETF had dropped when inflation is rising.
There are a couple of factors at play in explaining the loss in value.
1. 100% investment in government bonds
The ETF invests in about 13 government bond issues and about 40% of the issues are very long dated with 10 years or more to maturity.
Government bond yields have started rising as the market expects a fairly rapid rise in interest rates in the coming months to curb growing inflation. Government inflation linked bonds have a fixed rate component, so will to a degree have been sold off, to reflect an expectation of imminent higher government bond yields. Longer dated bonds are impacted more by even slight changes in sentiment and have lost value.
The longest dated government inflation linked bonds were issued in February 2018 and mature in February 2050. When they were issued, interest rates and inflation were low and so the bonds pay a low 1.00% per annum coupon for the next 28 years.
The coupon, the interest paid on the bonds, may have looked quite appealing in 2018, but with rising interest rate expectations now looks very expensive.
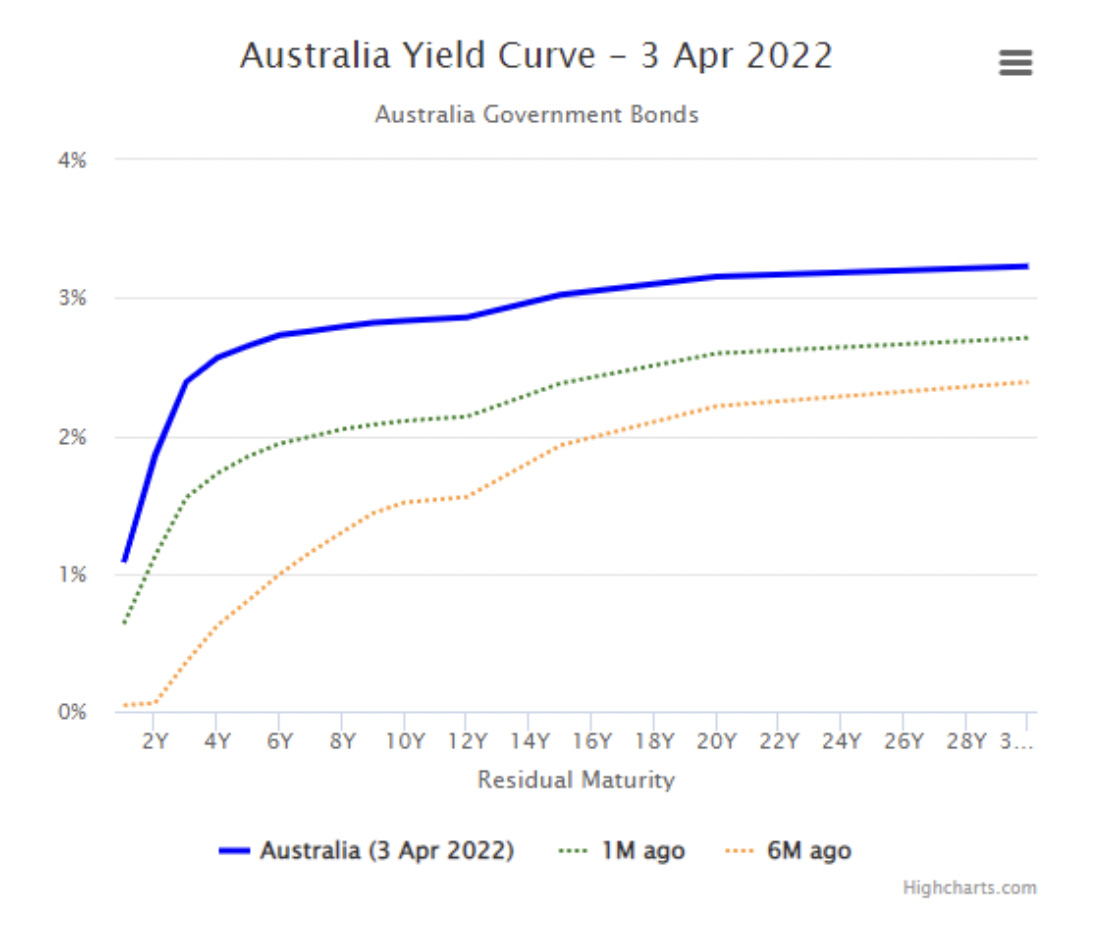
The Australian government bond yield curve (simply the yields on existing bonds until they mature over time) below shows how yield expectations have moved over time. Six months ago, as shown by the yellow dotted line, a 28 year term to maturity government bond yield was around 2.4%, one month ago as shown by the green dotted line, the yield was about 2.8% and as of 3 April 2022 the yield shown by the blue solid line, was approximately 3.2%. So, you can see how yield expectations have been changing.
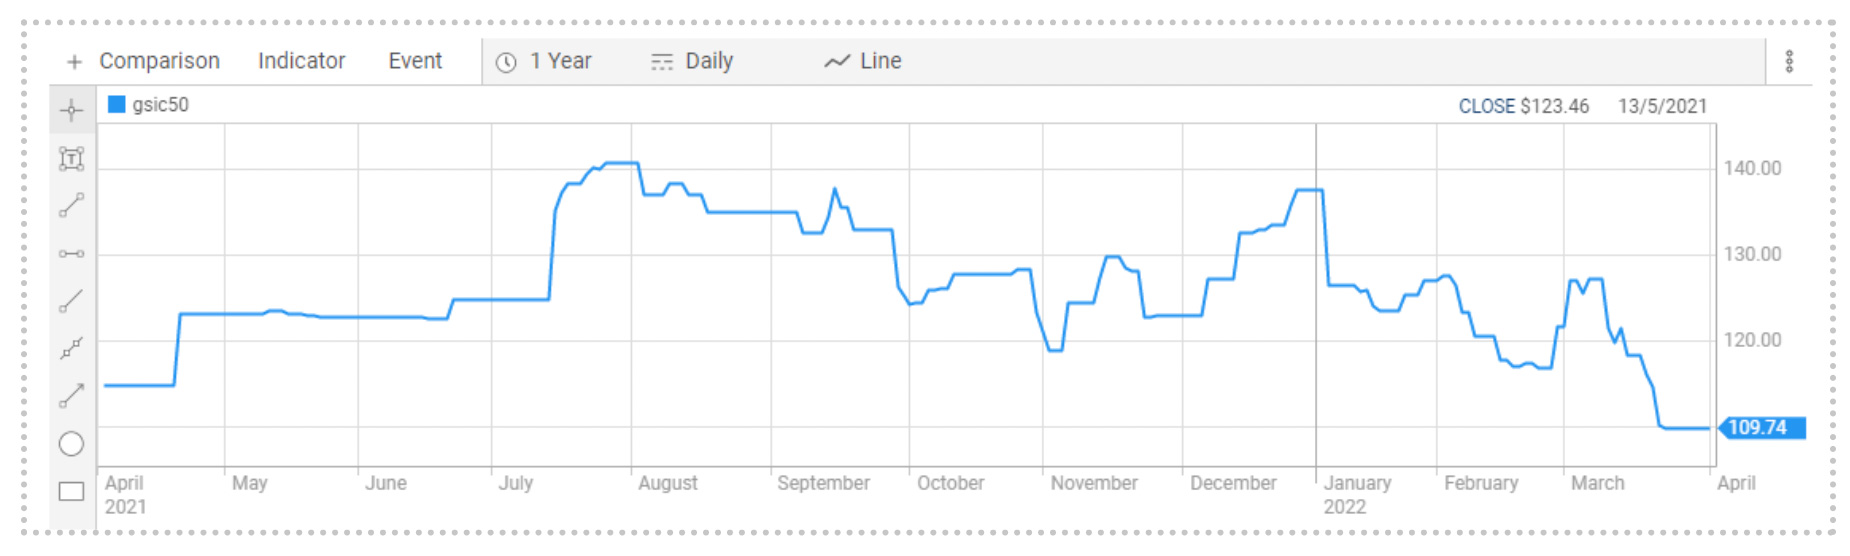
Here is the changing price of the bond over the last 12 months. It’s been quite volatile with a high of over $140 in July 2021 to its current low of $109.74 at 1 April 2022.
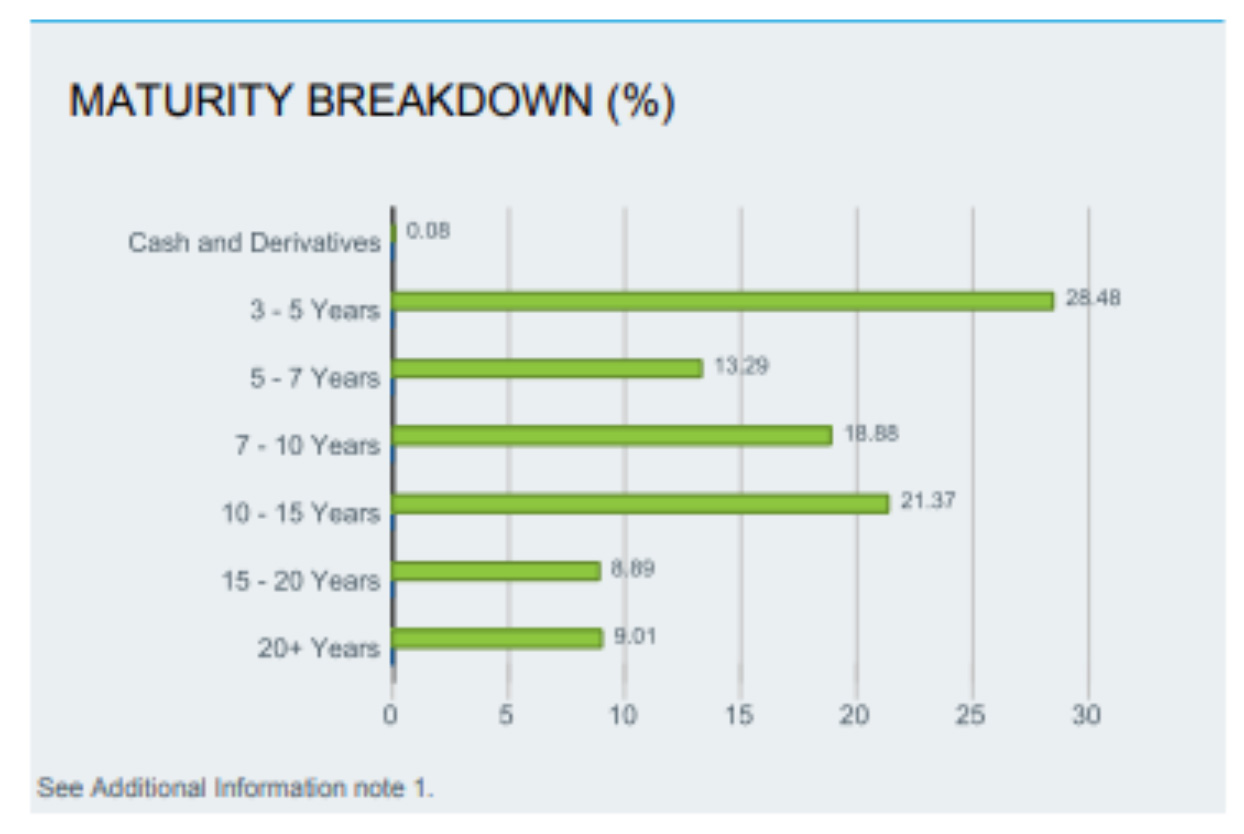
See the ILB ETF and its maturity breakdown below. Combining the graphic with the current yield curve above, will help you understand the significant term to maturity of the ETF and its sensitivity to changes in interest rates, or duration*.
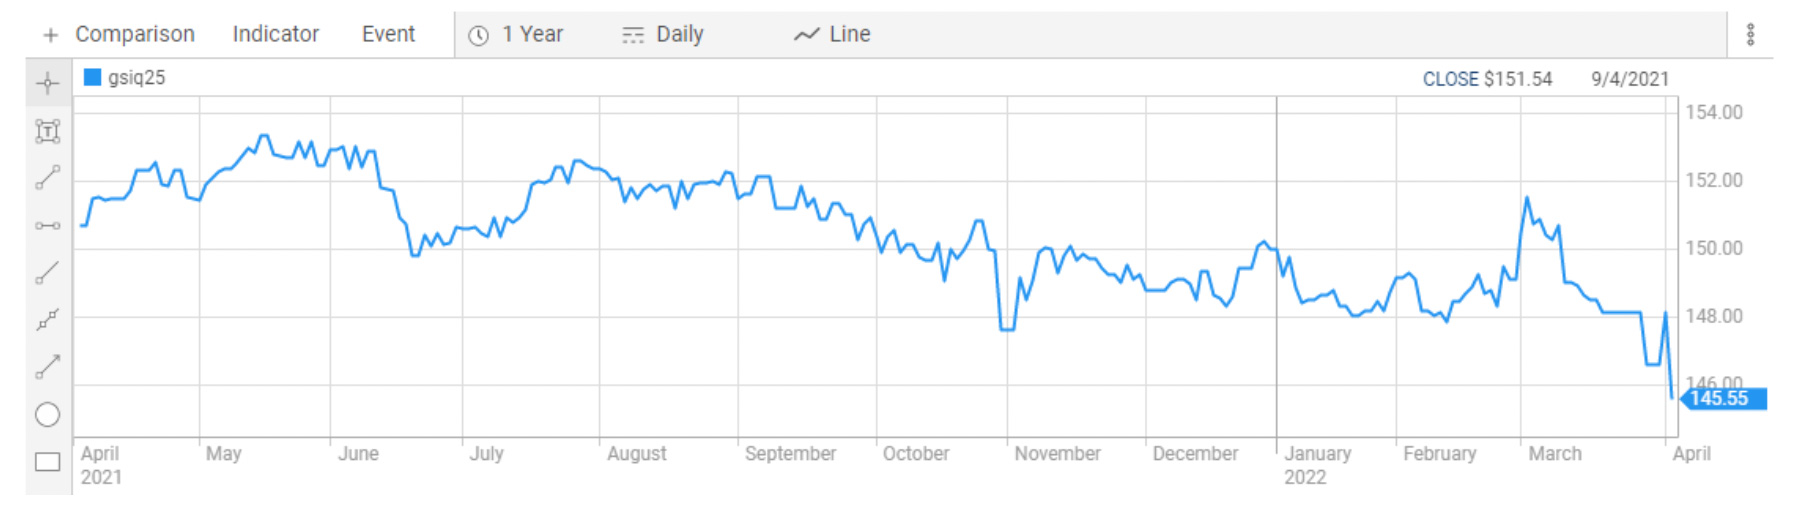
Shorter term to maturity ILBs won’t have experienced such large price swings. For example, the ILB’s top holding worth 23% of the portfolio is in a bond that matures in September 2025. Its fixed rate coupon is 3.00% per annum and while the price has declined, the swing has been much less. In the last year the bond price topped at $153.78 and reached a recent low of $145.02.
2. Passive investment
The iShares ILB ETF is a passive investment. It’s a buy and hold strategy. You accept interest rate risk of those longer dated bonds which may have further to fall if the market expects interest rates to rise further.
There are other managed funds that aim to beat inflation that have active management. There is no guarantee that they will beat inflation, but portfolio managers may be trading these bonds or using derivatives to help achieve their stated goals and are very unlikely to employ a buy and hold to maturity strategy.
3. The fixed income market moves on expectations
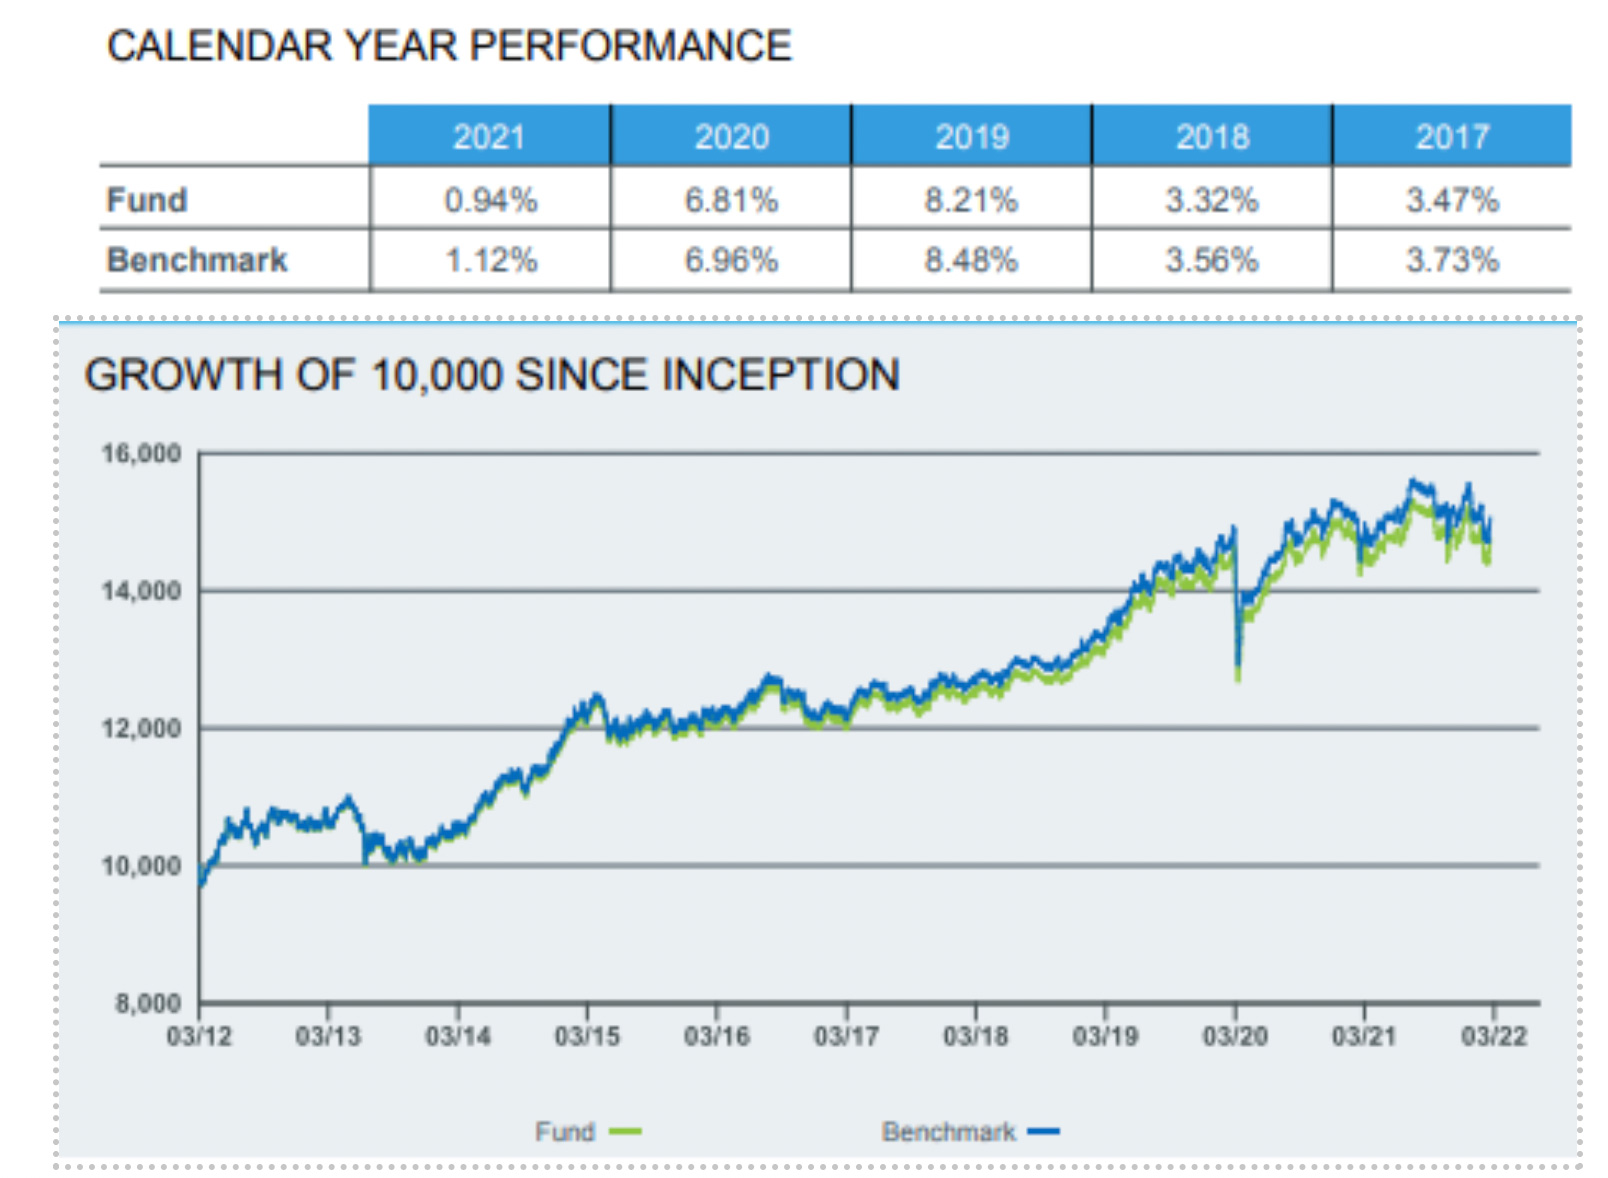
Fixed income markets move on expectations and inflation linked bond prices have been rising for the last 18 months or so, in expectation of higher inflation. Inflation linked bond prices were high last year and may have peaked. You can see this in the annualised returns on the fund (best years in 2020 and 2019 and much lower in 2021) and the chart of growth since inception of the fund.
Summary
There have been some massive inflows into the ILB ETF over the last few years and considerable outflows as well. Assets under management total $464 million as at 1 April 2022.
Investors should understand that the very low coupon on long dated government inflation linked bonds will act against it in a rising interest rate environment. Funds that include corporate inflation linked bonds will likely have larger fixed rate coupons that somewhat act as a buffer against higher interest rates. Corporate inflation linked bonds are also likely to be shorter dated, so less susceptible to interest rate risk.
*Duration
Duration measures a bond’s or fixed income portfolio’s price sensitivity to interest rate changes.
- Macaulay duration estimates how many years it will take for an investor to be repaid the bond’s price by its total cash flows.
- Modified duration measures the price change in a bond given a 1% change in interest rates.
- A fixed income portfolio’s duration is computed as the weighted average of individual bond durations held in the portfolio.


")


 Platform To Digitally Trade Corporate Bonds")


