


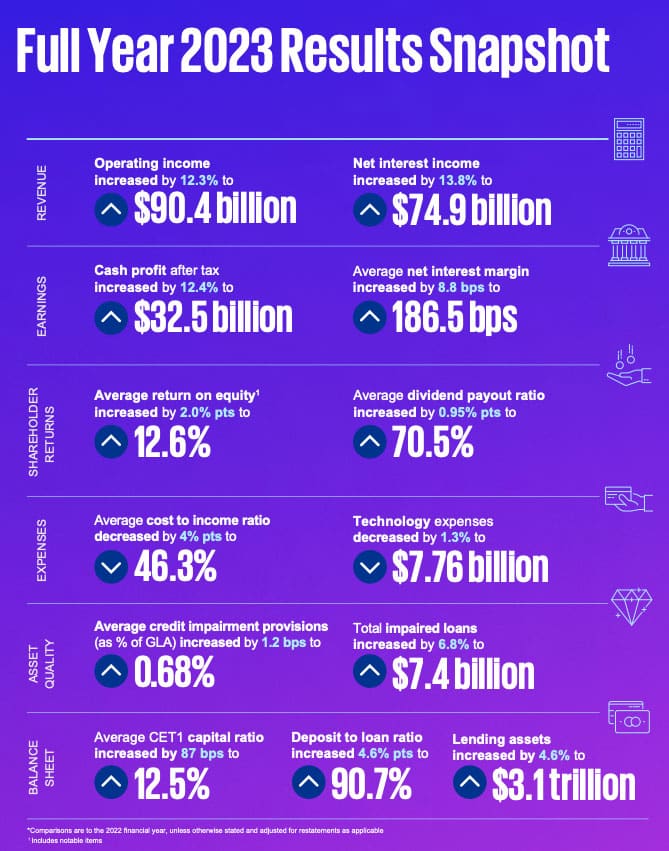
KPMG’s Australian Major Banks Full Year 2023 Results Analysis finds that the Majors reported a combined cash profit after tax from continuing operations of $32.5 billion, up 12.4 percent compared to FY22. The combined cash profits for the first half of FY23 amounted to $17 billion compared to $15.4 billion for the second half of the year.
The RBA’s tightening of monetary policy was the key driver of net interest margins, which increased by an average of 9 basis points on FY22 across the Majors. The average net interest margin for the Majors was 1.90% in the first half year, which decreased to 1.84% in the second half of FY23. In combination with an increase in interest-earning assets of 7.3 percent compared to FY22, net interest income increased by 13.8 percent to $74.9 billion.
Margins are however under pressure from both intense pricing competition, particularly in the home loan market, as well as the rising cost of deposit and wholesale funding.
Steve Jackson, Head of Banking & Capital Markets, KPMG Australia commented: “It has been another very strong full year result for the Majors, who have continued to grow during the year, despite cash profits and net interest margins falling in the second half as strong competition and rising funding costs offset the benefits of higher interest rates.”
Also read: Australian Insurers Adjust Their Portfolios for Inflation and Rising Interest Rates
The Majors booked $2.8 billion in impairment charges in FY23, which is a turnaround from releases in FY22. This contributed to a 1 basis point increase in the average provision as a percentage of gross loans and advances of 0.68% compared to FY22. The primary factor driving this increase was a shift in the forward-looking macroeconomic projections
The 90 day+ delinquencies as a percentage of gross loans and advances increased to 1.91% as compared to 1.73% in FY22.
Maria Trinci, Banking Partner, KPMG Australia added: “The Majors have reported a modest rise in arrears which suggests that interest rate rises and the erosion of savings buffers may be starting to impact consumers. However, this rise remains small and from a record low base, demonstrating the resilience of Australian consumers and businesses to date.”
The average cost-to-income ratio decreased to 46.3% from 50.2% in FY22, which is primarily driven by an increase in income. However, operating expenses have increased by 3.9 percent compared with FY22 reflecting an increase in personnel costs by 8.2 percent from FY22 in line with an increase in headcount of 1.9 percent. Investment spending has been relatively stable across all four Australian major banks, with an increasing share of investment in productivity and growth initiatives as the majors conclude the majority of their Royal Commission driven remediation programs and seek to maintain growth whilst creating efficiencies.
Capital and liquidity ratios across the Majors are well above regulatory minimums, demonstrating balance sheet and liquidity strength. The average Liquidity Coverage Ratio (LCR) increased to 134.3%, up 3.75 percentage points from FY22, and the average CET1 is 12.5%, an increase of 87 basis points compared with FY22.
The Majors declared higher dividend payments in FY23 with an increase in the average dividend per share of 15.7% per cent compared to FY22, resulting in an average increase of 32 cents per share. Notwithstanding the increase in dividend payments across the Majors, the average dividend payout ratio has remained steady at 71%.
Kim Lawry, Banking Partner, KPMG Australia commented: “The Major Banks further improved their strong capital positions during the year, strengthening their ability to reinvest in the business and provide returns to shareholders in the form of share buy-backs and dividends.”
Key highlights of the results are as follows:
- The Majors reported a combined cash profit after tax from continuing operations of $32.5 billion for the full year, an increase of 12.4 percent on FY22. The combined cash profits for the first half of FY23 amounted to $17.0 billion compared to $15.4 billion for the second half of the year. This result reflects increasing net interest margins compared with FY22 on average across the four Majors.
- Net interest margins across the four Major Banks increased in FY23 by an average of 9 basis points compared with FY22. The average net interest margin for the Majors was 1.90% in the first half year, which decreased to 1.84% in the second half of FY23. Margins are however under pressure from both intense pricing competition, particularly in the home loan market, as well as the rising cost of deposit and wholesale funding.
- The average cost-to-income ratio decreased from 50.2% in FY22 to 46.3%, which is mainly attributable to the increase in income. However, operating expenses have increased by 3.9 percent compared with FY22 reflecting an increase in personnel costs.
- Average provisions as a percentage of Gross Loans and Advances have increased in FY23 by 1 basis point compared to FY22 to 0.68%. This is primarily due to an 8.9 percent increase in the collective provision, reflecting a shift in the forward-looking macroeconomic projections.
- The average Liquidity Coverage Ratio (LCR) increased to 134.3%, up 3.75 percentage points from FY22. The average CET1 ratio across the four banks has increased by 87 basis points to 12.5% from FY22, showing continual strong capital buffers.
- The Majors declared higher dividend payments in FY23 with an increase in the average dividend per share of 15.7% per cent compared to FY22.
Major Australian Banks – Full Year 2023 Results Analysis


 Platform To Digitally Trade Corporate Bonds")


