


I was delighted when Peter Sheahan from Curve Securities emailed me last week after we published the ‘Has BBSW Peaked?’ article.
BBSW is calculated using market volumes known as volume weighted average (VWAP) calculation method. If there isn’t enough trading volume to calculate BBSW then there’s a waterfall where BBSW is calculated using, in the first instance a weighted least squares regression method, then a national best bid and offer (NBBO) method and finally, in the worst case scenario, a fall back method.
See ‘Bank Bill Swap Rate Riding a Wave’ for an explanation of the BBSW waterfall.
BBSW is calculated for various tenors. Sheahan sent the following note to his institutional investors last week, looking at BBSW volume trades in recent months.
As a result of all the zeros recently and the usual Volume Weighted Average Price (VWAP) not being used to calculate BBSW, I looked closely at the BBSW spreadsheet sourced from the ASX website that details the Daily Volumes and Tenor splits for the period May 2018 to present.
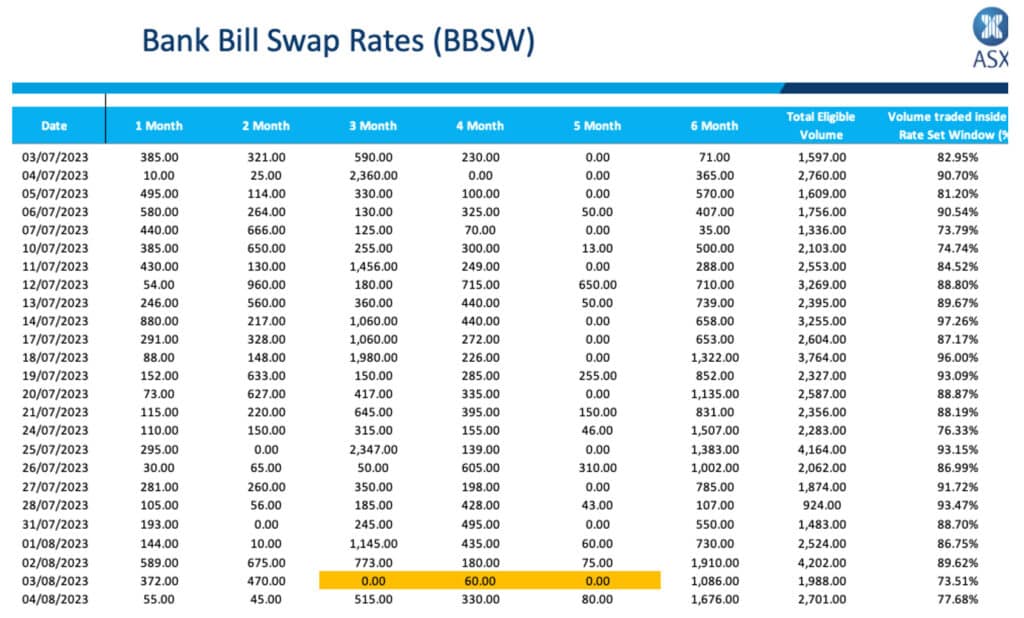
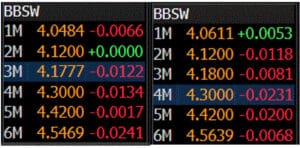
BBSW screenshot for 3 August 2023 and 8 August 2023 below:
Key Points
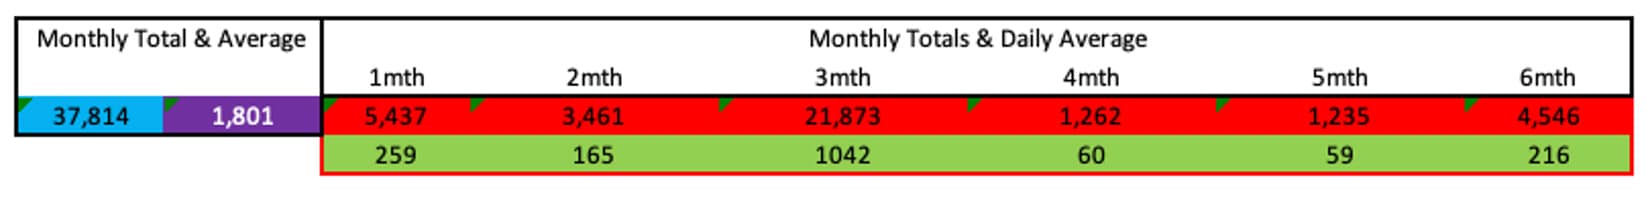
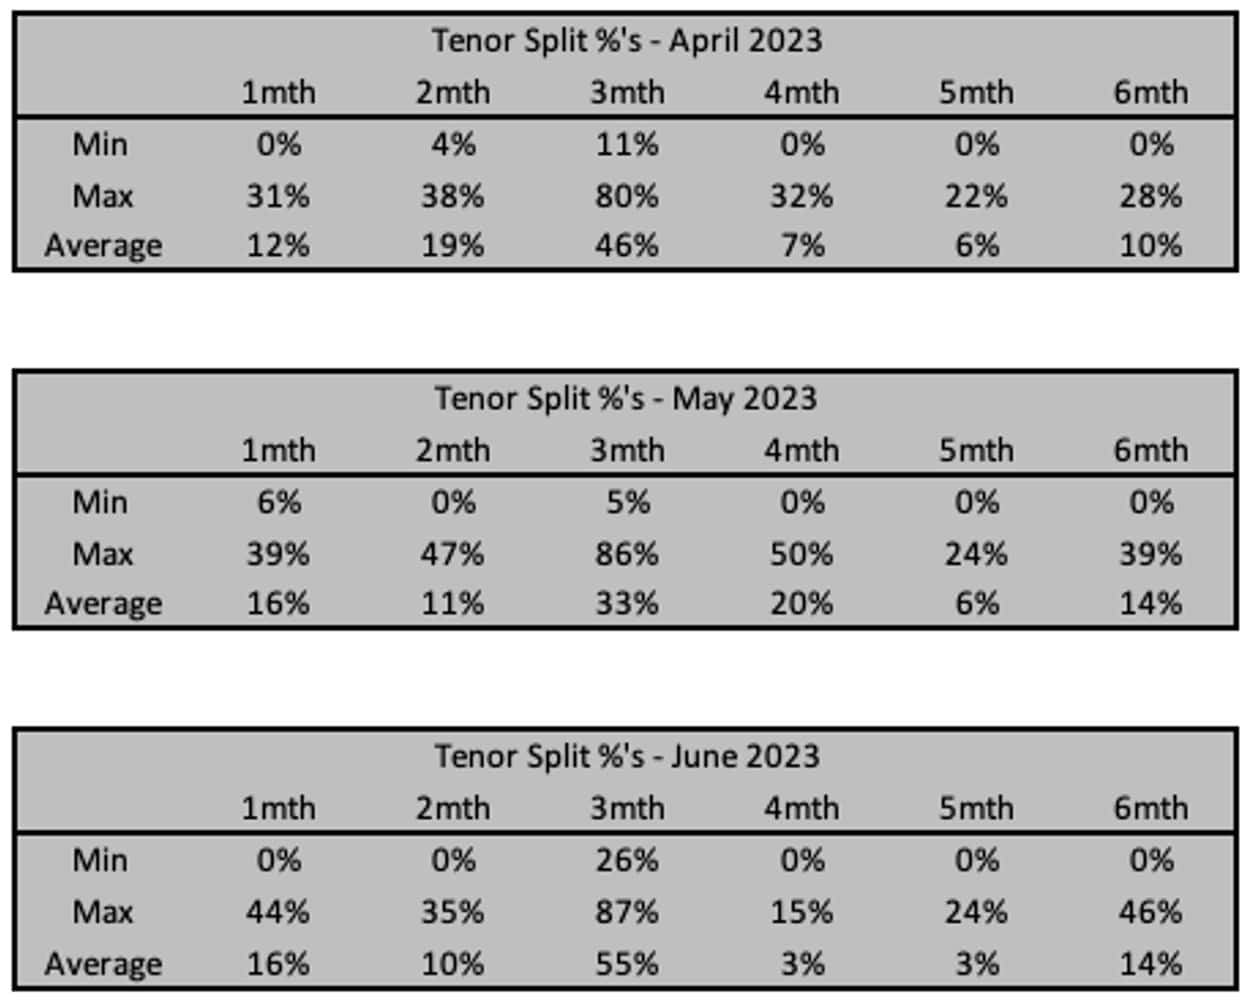
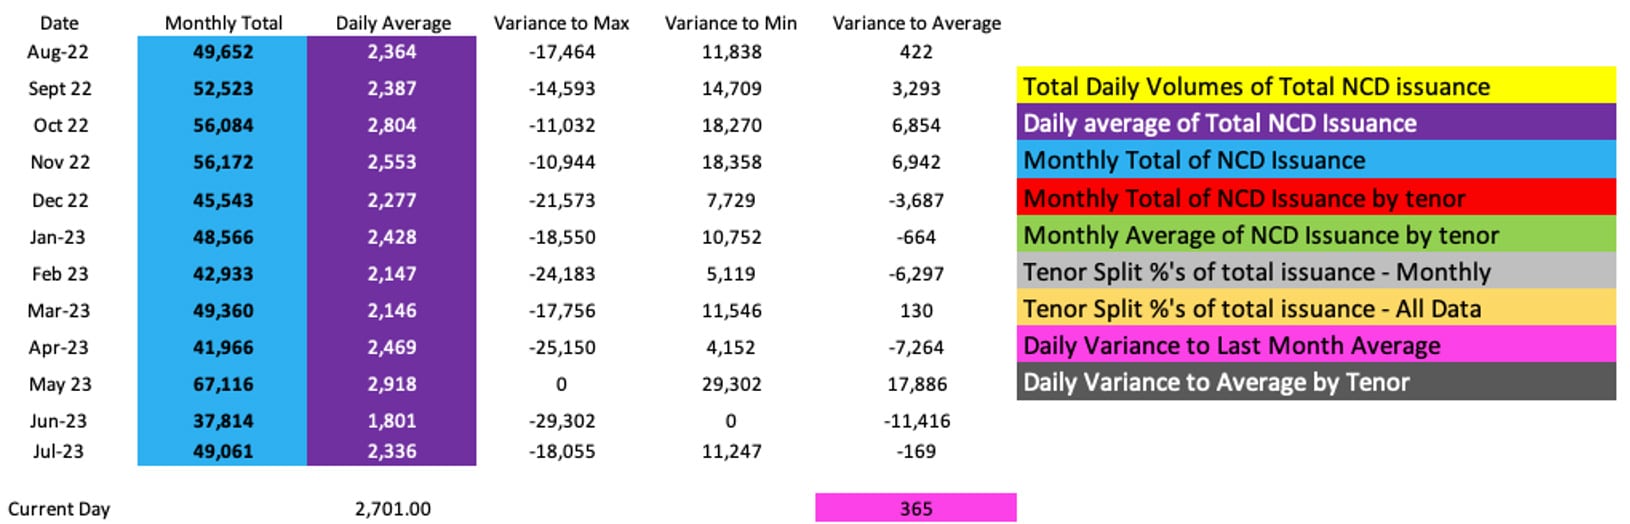
- June 2023’s monthly totals and daily average of were significantly below the year over year (YOY) average $49.2 bn for June 2022 versus $37.8bn and daily total of $1.8bn for June 2023. Note three month BBSW has the majority trading volume.
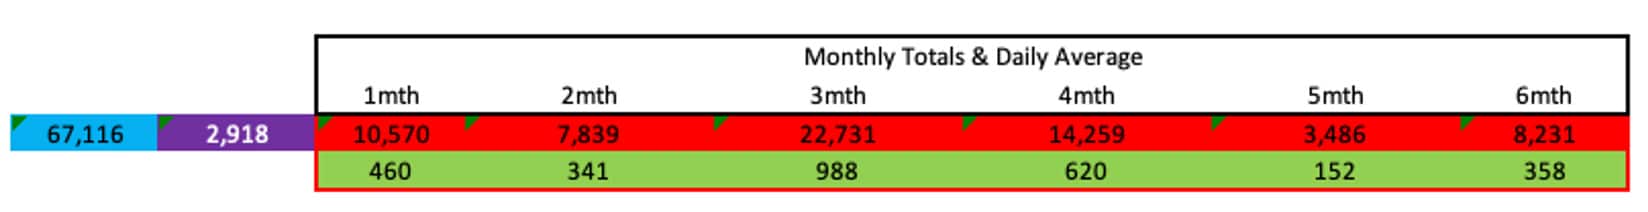
- May 2023’s monthly totals and daily average were significantly above the YoY average $49.2 bn for May 2022 versus $67.1bn and daily total of $2.9bn. Note trading volume by term is more evenly distributed, but tens of billions trading in the one month and 4 month buckets.
- The all-time daily tenor split percentages of baseline 3mth BBSW and 6m BBSW is 28% and 30% is a respectively
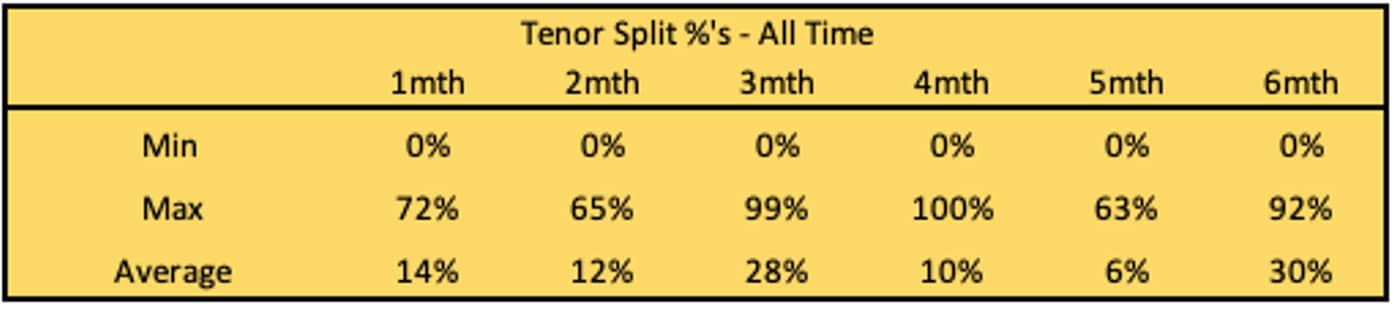
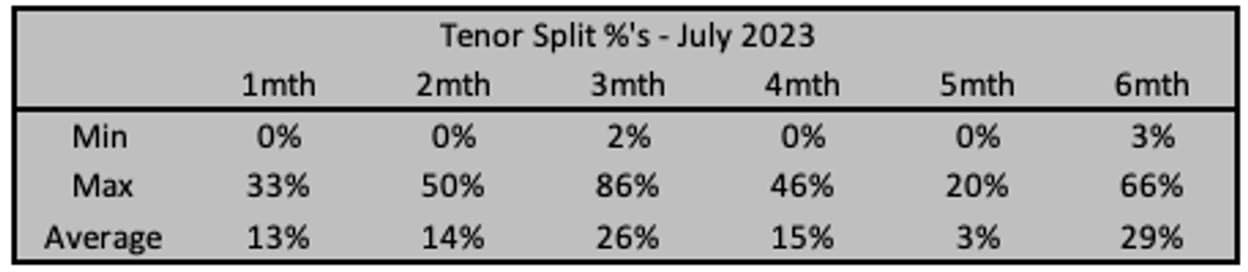
- July 2023’s average split shows no distinct variance
- April, May and June 2023’s variances have an extraordinary large bias toward short tenors, that is three and four months
- The 4 days of August 2023 data is where the real story lies – the significant shift to 6m BBSW since the RBA paused interest rates on 1/8/23 is stark.
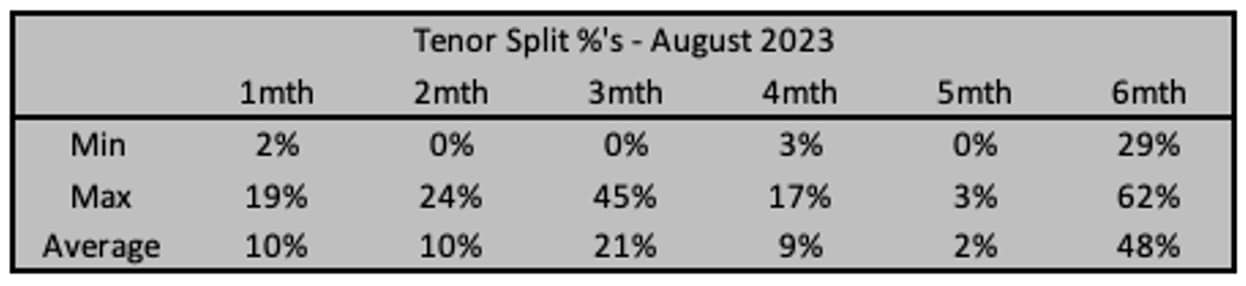
The volume data for the last month or so, confirms the daily shift is noteworthy. This will probably revert to normal distributions when the 37bps steepness across 3 month and 6 month BBSW rates are reduced to less than 10 bps.
Historically, Negotiable Certificates of Deposit (NCD) issuance is a major bank balance sheet funding and interest risk management tool, but lately it’s showing the distinct characteristics of being an investor lead liquidity management vehicle.
A monthly totals, daily average and variances summary table is below along with a legend of all analysis undertaken.
Sheahan says the data suggests investor behaviour is now lengthening the maturity profile of short-term investments. Whilst these observations beg the question “Has BBSW Peaked?”, greater certainty across macro-economic indicators of a slowing economy is warranted before a real pivot of our 18 months of aggressive upward momentum occurs. Does an extended “rates plateau” present itself in a more normal distribution pattern of daily volumes?


")


 Platform To Digitally Trade Corporate Bonds")

