


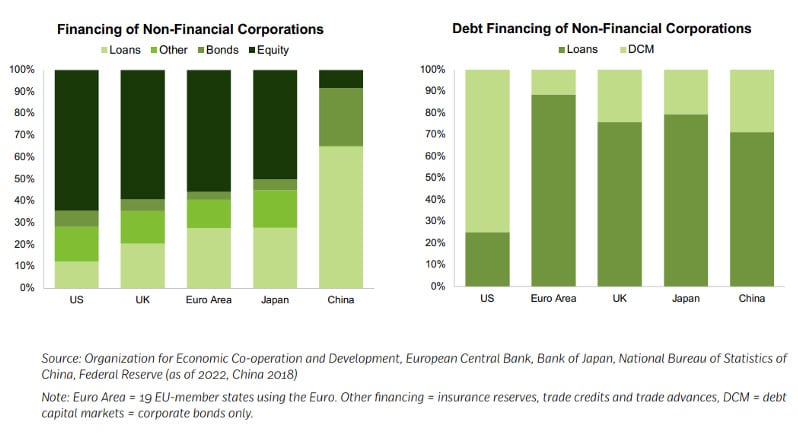
SIFMA is a US securities industry member association and they do a lot of work advocating for effective and resilient capital markets. Its recent 2024 Capital Markets Outlook provided some valuable insight into global equity and fixed income markets. In this article, we republish some of its insights.
According to SIFMA, the global fixed income market is 25% larger than the global equity market. The Australian equities market makes up just 1.6% of global equities, while our domestic fixed income market is smaller and does not make it onto the global chart shown below.
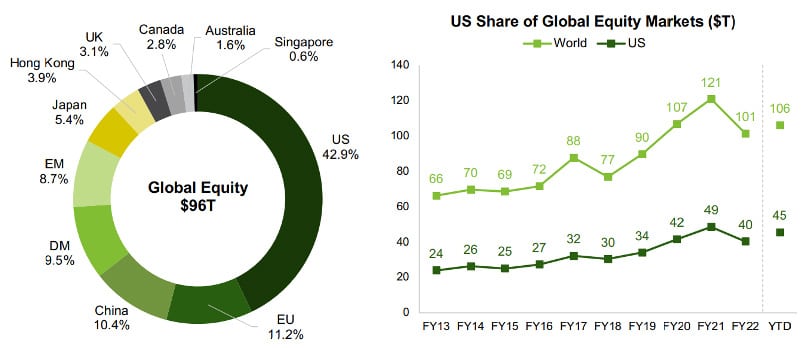
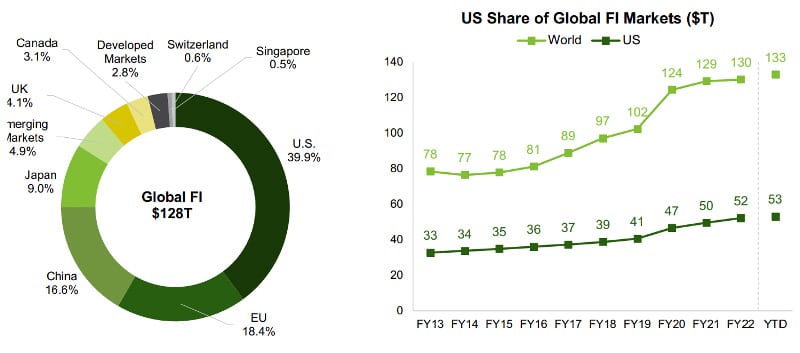
US Capital Markets are the Largest in the World
The U.S. capital markets are the largest in the world and continue to be among the deepest, most liquid and most efficient.
Equities: U.S. equity markets represent 42.9% of the US$106 trillion in global equity market cap, or US$45 trillion; this is 3.8x the next largest market, the EU.
Also read: Fixed Income Enters Golden Age
Fixed Income: U.S. fixed income markets comprise 39.9% of the US$133 trillion securities outstanding across the globe, or US$53 trillion; this is 2.2x the next largest market, the EU.
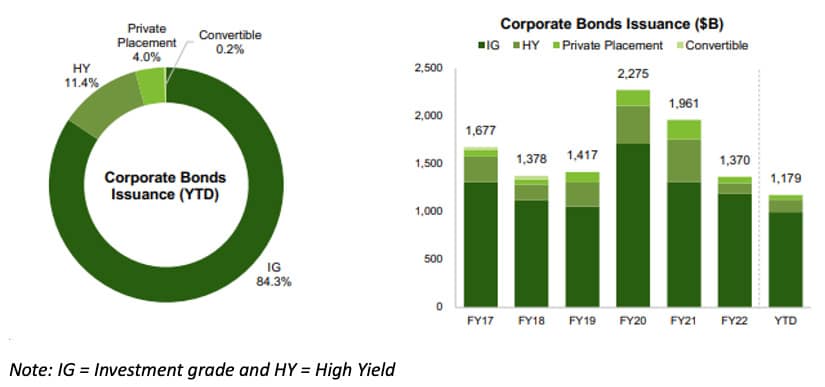
Fixed Income Issuance
Total long-term fixed income issuance was US$8.9 trillion in 2022, -33.9% year over year (Y/Y), and US$6.2 trillion YTD 2023 (through October), -11.2% Y/Y. Issuance has increased at a +3.6% CAGR over the last five years.
U.S. total Treasury issuance was US$16.7 trillion in 2022, -14.3% Y/Y, and US$13.9 trillion YTD 2023 (through October), -24.9% Y/Y. Issuance has increased at a +9.8% CAGR over the last five years. Long-term U.S. Treasury issuance was US$3.8 trillion in 2022, -25.5% Y/Y, and US$2.5 trillion YTD 2022 (through October), -13.8% Y/Y. Issuance has increased at a +7.3% CAGR over the last five years.
MBS issuance was US$2.1 trillion in 2022, -53.2% Y/Y, and US$1.0 trillion YTD 2023 (through October), -45.4% Y/Y. Issuance has increased at a +2.8% CAGR over the last five years.
Corporate bonds issuance was US$1.4 trillion in 2022, -30.2% Y/Y, and US$1.2 trillion YTD 2023 (through October), +2.9% Y/Y. Issuance has slightly decreased at a -0.1% CAGR over the last five years. The top three sectors corporate bonds issuance YTD were Financials (57.9% of total), Energy & Power (11.9%) and Industrials (8.1%).
Fixed Income Outstanding
Total fixed income outstanding was US$52.9 trillion in 2022, +5.5% Y/Y, and US$54.0 trillion YTD 2022 (through June), +4.7% Y/Y. Outstanding has grown at a +6.3% CAGR over the last five years.
U.S. Treasury outstanding was US$23.9 trillion in 2022, +7.7% Y/Y, and US$24.9 trillion YTD 2022 (through June), +6.8% Y/Y. Outstanding has grown at a +8.9% CAGR over the last five years.
MBS outstanding was US$12.2 trillion in 2021, +8.8% Y/Y. Outstanding has grown at a +6.2% CAGR over the last five years.
Corporate bonds outstanding was US$10.4 trillion in 2022, +1.6% Y/Y, and US$10.6 trillion YTD 2023 (through June), +2.2% Y/Y. Outstanding has grown at a +4.2% CAGR over the last five years.


 Platform To Digitally Trade Corporate Bonds")


