


Alex Veroude, Head of Fixed Income, Janus Henderson, looks at how the breadth of fixed income markets can help balance risks and opportunities and explains why he believes a sense of perspective can help cut through market noise.
A war between Israel/US and Iran was on few people’s radar heading into 2026. Our message of seeking resilience in our annual outlook, therefore, turned out to be sage. Challenges to fixed income markets in the first half of 2026 predominantly reflected a shift in interest rate expectations as markets grew concerned that higher energy prices from disrupted oil and gas flows from the Middle East could ultimately feed through into broader inflation.
Rates dominate credit
The global economy defied doom-mongers, but geopolitical tensions found an outlet in rates volatility. Sovereign bond yields rose, reflecting the monetary policy realignment as prospects for rate cuts broadly gave way to pauses and, in some cases, hikes. Fresh fiscal concerns also lifted yields, with longer-dated bond yields breaching the highs of recent years in most developed markets.
With the outlook for US central bank rates policy still in the balance, and leaning hawkish elsewhere, we remain cautious on duration risk. Inflation concerns have risen, not just because of the fallout from the Middle East conflict but also because economies have been more resilient than expected. Meanwhile, artificial intelligence (AI)-related spending is proving inflationary initially (e.g., higher chip/memory costs) ahead of anticipated productivity gains.
That said, the back-up in yields and volatility in rates may present some tactical opportunities. Provided any second-order effects on inflation from the supply disruption in the Middle East are contained, a resolution to the war could see yields move lower. Much depends on how long the shipping traffic through the Strait of Hormuz remains disrupted. Such an equivocal rates outlook may favour the floating-rate structure of many securitised assets.
The upward move in sovereign yields lifted yields on corporate bonds, denting returns. Yet the global economy proved remarkably resilient. Consumption held up (often in defiance of gloomy responses in surveys), and labour markets did not buckle.
Credit spreads (the additional yield a corporate bond pays over a government bond of similar maturity, and generally viewed as a barometer of corporate health) completed a round trip. They widened early in the conflict but have since moved back closer to where they began the year, which was near their 20-year tights. The exception was the lowest-quality debt (CCC rated), where spreads are around average levels, suggesting the market is discriminating between better- and poorer-quality borrowers.
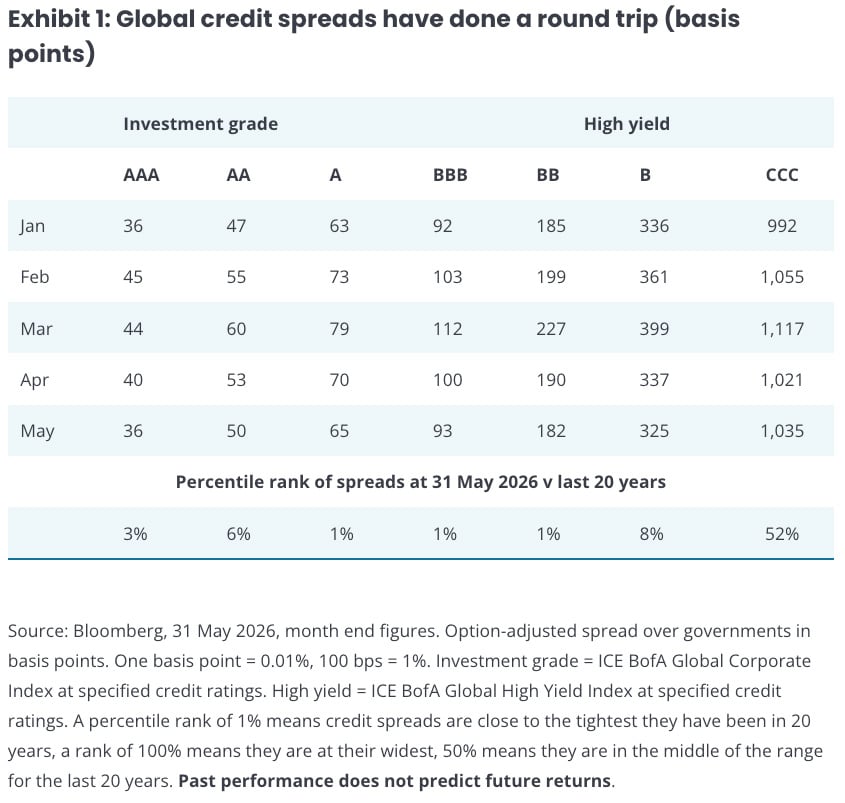
While spreads may be low relative to the last 20 years, overall yields are still attractive because government bond yields are near their highest levels over this period. This creates demand from income-seeking investors despite tight spreads. Ultimately, spreads follow the economic cycle and, so far this year, there are few signs of a major deceleration in economic growth. It is possible that the lagged impact of the Middle East conflict could bite in coming months, so investors should be on their guard, but we believe there may be an opportunity cost to being overly cautious.
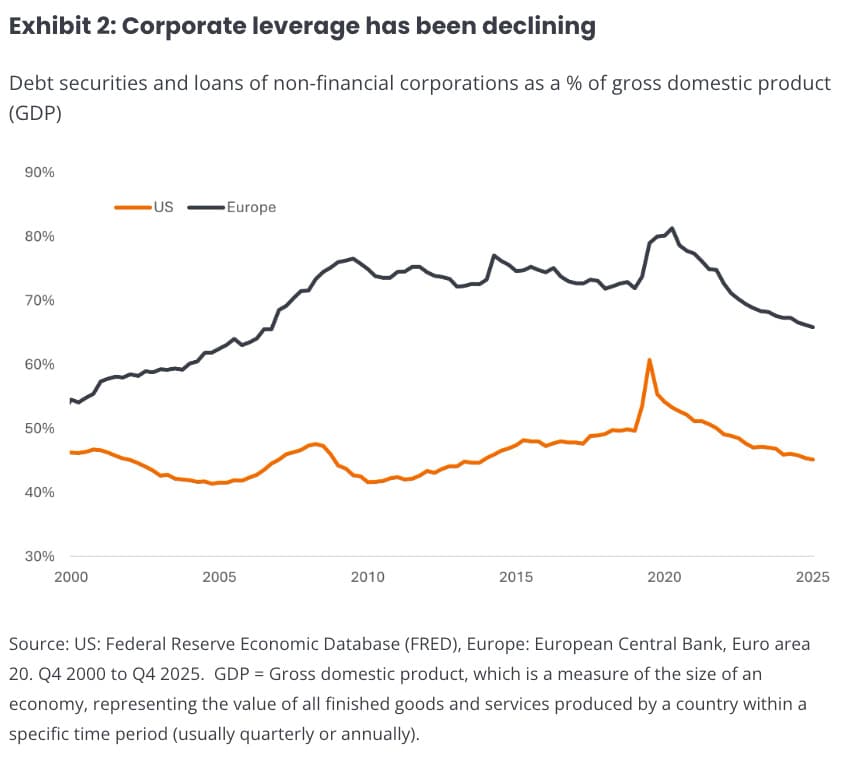
Strong earnings have helped sentiment. For Q1 2026, the S&P 500® Index reported year-over-year earnings growth of 28.6%, the fastest since Q4 2021 (a figure that was positively distorted by the bounce-back from COVID).1 There is an argument that the market might be complacent, but the trend of recent years towards tighter spreads has its origin in strong fundamentals. Corporate leverage has been declining recently, and this is not just a US phenomenon.
Add to the mix strong household balance sheets, low unemployment across many countries, real wages rising until the recent energy price spike, and US tax cuts, and it becomes easier to justify the tightness in spreads.
Supply creates its own demand
This notion of declining corporate leverage might seem to fly in the face of the heavy supply of bonds from hyperscalers as they invest in AI. Approximately US$800 billion in CapEx is forecast to be spent this year alone by hyperscalers.2 Markets may have to absorb around US$240 billion in AI-related bond issuance in 2026.3 While the overwhelming majority of this issuance is coming from some of the highest-quality borrowers, many of which have little to no net debt, the sheer quantum of new issuance may test investors’ appetites and could weigh on company spreads. Opportunities from the AI build out are also being created among securitised sectors, notably within infrastructure asset-backed securities (ABS).
For other borrowers, there may be a ‘crowding-out’ effect, potentially causing some modest spread widening in the second half of 2026. Set against this is the fact that money borrowed and spent helps drive revenues elsewhere in the economy. A key risk to markets would be if hyperscalers rowed back on their spending plans, as this could pierce bullish sentiment and be damaging for risk assets.
We are currently in a nebulous phase for AI. No one is sure what the full costs and benefits will be, but it is already a transformational technology helping to deliver an economic boost. Worries about AI displacing existing business models have led to software businesses coming under pressure, which in turn has created challenges within parts of the private credit market – more around negative headlines related to caps on redemptions than anything more systemic. At the other end of the scale are so-called HALO (heavy assets, low obsolescence) companies such as energy grids, commodities, and manufacturing that are seen as broadly immune to displacement.
Diversity of yield sources
We are mindful that ongoing equity market strength has created ebullience. The chances of a correction in equities may be building: the lagged effects of the closure of the Strait of Hormuz, if not resolved soon, could come home to roost through weaker growth or higher inflation; the Fed could signal a shift towards raising rates; and the heavy equity IPO calendar (often a herald of a market top) could trigger indigestion.
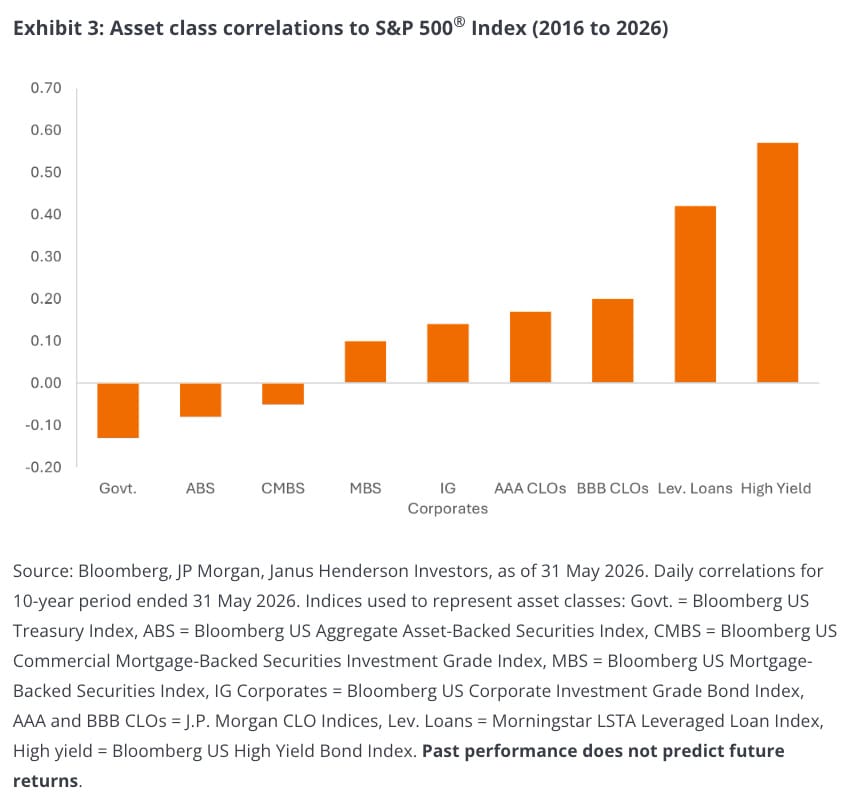
It may be useful to consider which areas of fixed income are less correlated to equities. After all, alongside income, fixed income asset classes are often sought as a portfolio diversifier. High yield bonds, which are sensitive to corporate conditions, have the closest correlation to equities. Government bonds typically have a negative correlation, as they often outperform when the macro environment weakens.
Securitised assets, such as ABS and commercial mortgage-backed securities, offer low to negative correlation to equities. In part, this is because they tend to respond to specific or differentiated cycles (housing supply, travel, retail consumption, rental markets, etc), and securitised indices are often of higher credit quality than corporates.
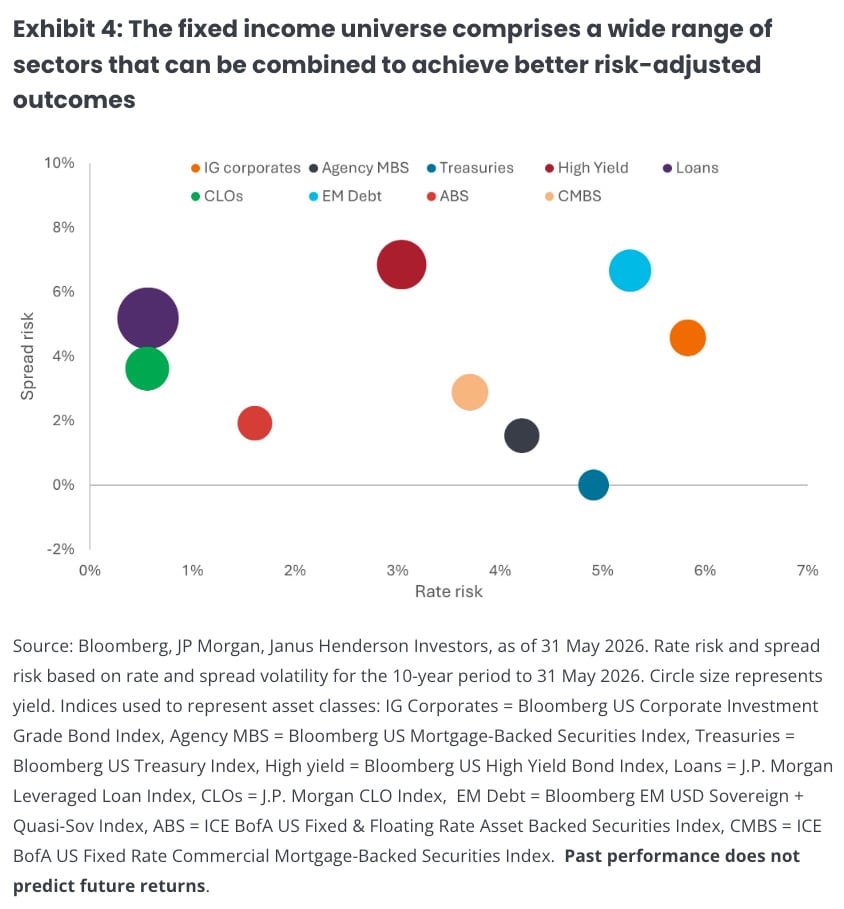
Given the uncertain outlook for markets, the broad range of fixed income sub-asset classes offers a useful toolbox for portfolio construction. Exhibit 4 shows volatility for different asset classes from two different factors: rate risk (movements linked to changes in interest rates) and spread risk (movements linked to changes in confidence that a borrower can repay). Investors seeking to limit their sensitivity to changes in interest rates may hold more in the way of loans with their floating-rate structure, or collateralised loan obligations (CLOs).
At the other end of the scale, investment-grade corporate bonds would likely respond most positively to a rate cut. Investors worried about growth prospects could limit spread (credit) risk through a holding in Treasuries or agency mortgage-backed securities (MBS). Conversely, high yield and emerging market debt likely offer more potential in an environment of resilient economic growth.
Blending asset classes or employing hedging strategies can help investors achieve a desired risk profile and outcome. Earlier we noted how corporate bond spreads were near their tights. This is not true for securitised assets, where spreads, and in turn yields, remain at relatively attractive levels, allowing investors to maximise their income per unit of risk. The circle widths in Exhibit 4 represent the size of average yields at 31 May 2026 (for example, the yield on US Treasuries is 4.3% and the yield on US loans is 8.6%).
We have said for some time that investors should look beyond the narrow confines of traditional areas of fixed income and embrace some of the opportunities and diversification potential of the full breadth of the asset class.
The first half of 2026 threw some curveballs at investors. But by putting things into perspective, we can understand why markets have behaved in a certain way and objectively look to seek opportunities and mitigate risks within portfolios.


 Platform To Digitally Trade Corporate Bonds")


