


Ninety One’s Multi-Asset Credit team explains that various factors are distorting the headline index spread in the US high-yield market and suggests investors look to other parts of the global credit investment universe for better risk-adjusted value.
The difference between the median (a more accurate indicator for investors) and headline index spread is at a 20-year high.
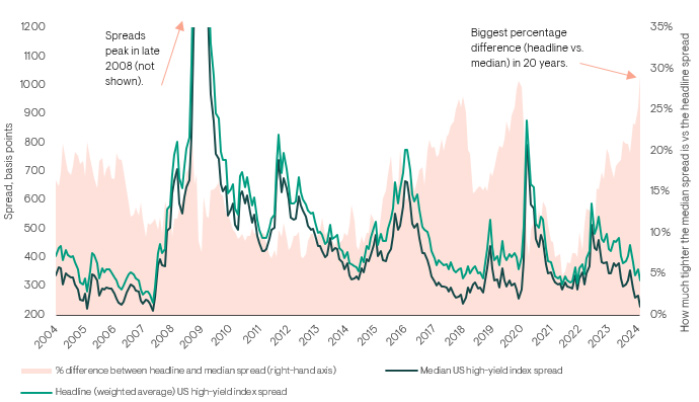
Source: ICE BofA US High-Yield Index (HUCO). 23 February 2024. For information on indices, please see the important information section. Peak spreads not shown in chart: 1959bps (headline); 1637bps (median).
The context
Attractive yields are enticing investors back to credit markets. Certain markets offer attractive compensation for risk, but in more traditional areas a combination of strong inflows and limited net issuance has driven spreads to historically tight levels. Furthermore, Darpan Harar, Portfolio Manager, Ninety One, warns that headline index spreads for such markets are often painting a misleading picture, effectively overstating how much investors are likely to earn. The US high-yield market is a key example.
Harar says: “Investors who ‘buy the market’ will not necessarily earn the headline spread of the US high-yield index. As a weighted average, this headline spread assumes that all index constituents – including very distressed bonds – will be redeemed at par. In reality, some of these distressed issuers will likely default, and thus a portion of that spread is unlikely to ever be realised (this is often referred to as the ‘phantom’ spread).”
Additionally, there is currently a high level of dispersion (‘fat-tails’) in the high-yield market – something Ninety One’s Multi-Asset Credit team has noted before. This reflects higher-quality (BB rated) segments receiving far more investor interest than riskier (CCC rated) segments
Harar explains: These two dynamics have resulted in the median index spread – a more accurate representation of the typical spread in the market – being significantly lower than the headline index spread. As shown in the chart, the median spread today is at its tightest since 2007 and c.30% (100bps) tighter than the headline index spread. The difference between the two is the largest it has been in 20 years.
Also read: Debate Rages Over the Strength of the Cycle and Policy Easing
The conclusion
“Given how expensive the asset class has become – the full extent of which is not captured by the headline index spread – we believe that a static, index-level allocation to US high-yield is unattractive.
“We have reduced the US high-yield allocation within our Multi-Asset Credit strategies to an all-time low. Looking across the wider global credit market opportunity set, we find better risk-adjusted value in segments such as structured credit, bank loans, and subordinated financial bonds. Investors should broaden their horizons to find the best opportunities on offer in credit markets today.”


 Platform To Digitally Trade Corporate Bonds")


