


By Ardea Investment Management
Summary
- Bond yields are rising again, and central banks have turned more hawkish (when a central bank wants to guard against inflation and is willing to allow interest rates to rise to keep inflation under control)
- The Fed will soon commence Quantitative Easing (QE). The impact on bond yields is likely to be limited by the large absolute size of the Fed’s balance sheet and offsetting issuance flow dynamics.
- Policy rate expectations have more room to move. Current Fed forecasts and market projections still represent a glacial pace of policy tightening by longer run historical standards.
- Global rates markets have moved to price more aggressive policy rate hike assumptions and greater divergence is evident between markets – a theme that is likely to continue.
- High levels of inflation and growth uncertainty point to higher rates volatility.
Global bond yields have risen notably over the last few weeks. The market is reacting to a hawkish shift in central bank communication, improving confidence in the growth outlook and signs of increased inflation pressure. The Fed’s QE tapering is widely expected to be announced in November. We examine the market implications of reduced QE purchases and the differences with the 2013 experience. Ultimately, policy rate expectations will have a greater impact and a global repricing is now underway. Cross market differences are likely to grow from here amid increased inflation and central bank divergence.
The Fed is about to start tapering QE, will it matter much for markets?
The Fed is expected to soon begin tapering the pace of its asset purchases, representing a reduction in direct policy support and intervention in bond markets. The Fed’s balance sheet is set to grow at a slower pace while tapering is underway, before levelling out at a new, higher level, as coupon and maturity proceeds continue to be reinvested.
Fed Chair Powell said that tapering could be formally announced at the next meeting in November.
The approach of tapering has contributed to the rise in bond yields over the last month. However, the overall moves in interest rate markets are tame by historical standards. One reason for the modest market reaction is that tapering is not a big surprise. Market participants already expected QE to be reduced over the course of 2022.
The lack of investor surprise reflects earlier Fed communication and economic progress relative to policy settings still calibrated for a deep recession. So far, bond markets are avoiding the sort of damage seen the last time the Fed foreshadowed a major reduction of bond purchases – the 2013 “taper tantrum”. Back then the US 10y nominal yield between May and September 2013 lifted over 100bp to a high of 3.05% and the 10y real yield lifted 130bp to a high of 0.92%.
Other bond markets also suffered heavy losses at the time and there were spillovers into other asset classes.
To understand the reasons tapering is less disruptive for markets this time around and to what extent this might change, it’s worth taking a closer look at the two main channels through which QE impacts the bond market.
1) The direct impact of QE purchases
The Fed’s asset purchases work to reduce the supply of US Treasury and MBS assets in the market, directly lowering the yields on those investments. In turn, there is a portfolio balance effect, whereby investors replace longer duration, safer assets with riskier assets such as credit and equities. The lower benchmark yields and reduced premiums on riskier assets provide stimulus to the economy through broadly easier financial conditions.
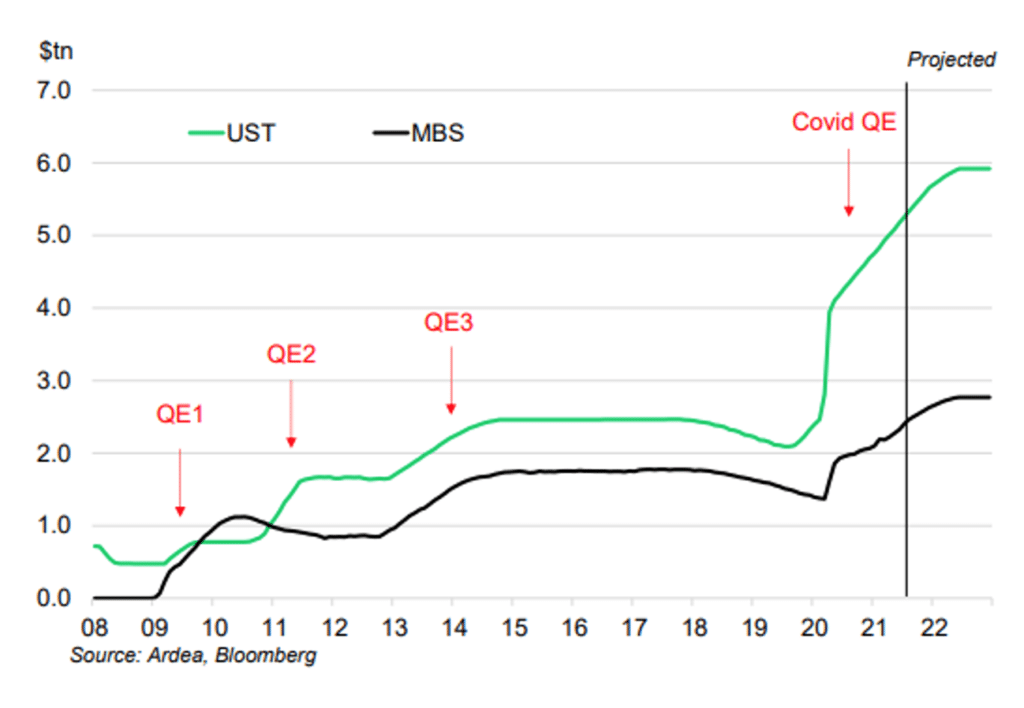
QE purchases impact bond yields through a stock and flow effect. That is, both the overall size of the Fed’s balance sheet and flow of after-QE net supply work to lower yields. In practice, quantifying the stock and flow effects is difficult, but analysts generally accept that both impact the market. Various in-depth studies have attempted to quantify the impact of previous rounds of QE from other drivers of the market (often called QE1, QE2 and QE3). Some pre-COVID studies show that QE lowered the US 10y term premium by as much as 100bp (see here for example). We can also simply observe that yields have tended to fall leading into QE announcements as the market anticipates Fed purchases. The US 10y yield fell over 60bp in the month leading up to the Covid QE announcement and the market tracked low yield ranges in the months that followed (although there were other forces at play as well).
The stock effect of QE will remain significant even after tapering. As Chart 2 shows, the Covid QE program is massive relative to prior programs. The Fed now holds around 20% of the US Treasury market. The end of tapering will only stop the Fed’s holdings from rising – they will still hold a massive portfolio of bonds and will be reinvesting maturities and coupons for the foreseeable future. The larger and more predictable absolute size of the balance sheet appears to be giving markets greater comfort now than in 2013.
Chart 1: Fed bond holdings
The flow effect also matters. Yields could still rise as incrementally less Fed buying leaves more bonds for the market to absorb over the next year. However, big moves seem unlikely to the extent that new bond issuance also impacts the amount of net supply available to the market. At the same time the Fed is reducing purchases, issuance of US treasuries is also set to moderate. There is still significant uncertainty surrounding this outlook. If fiscal policy is again expanded significantly, it could have a greater effect on yields in an environment of lower Fed purchases.
2) The policy rate signalling channel
Beyond the direct impact of suppressing bond yields, QE serves to reinforce market expectations that policy rates will remain at the lower bound for longer. The tapering of QE can therefore be thought of as taking a step towards rate hikes.
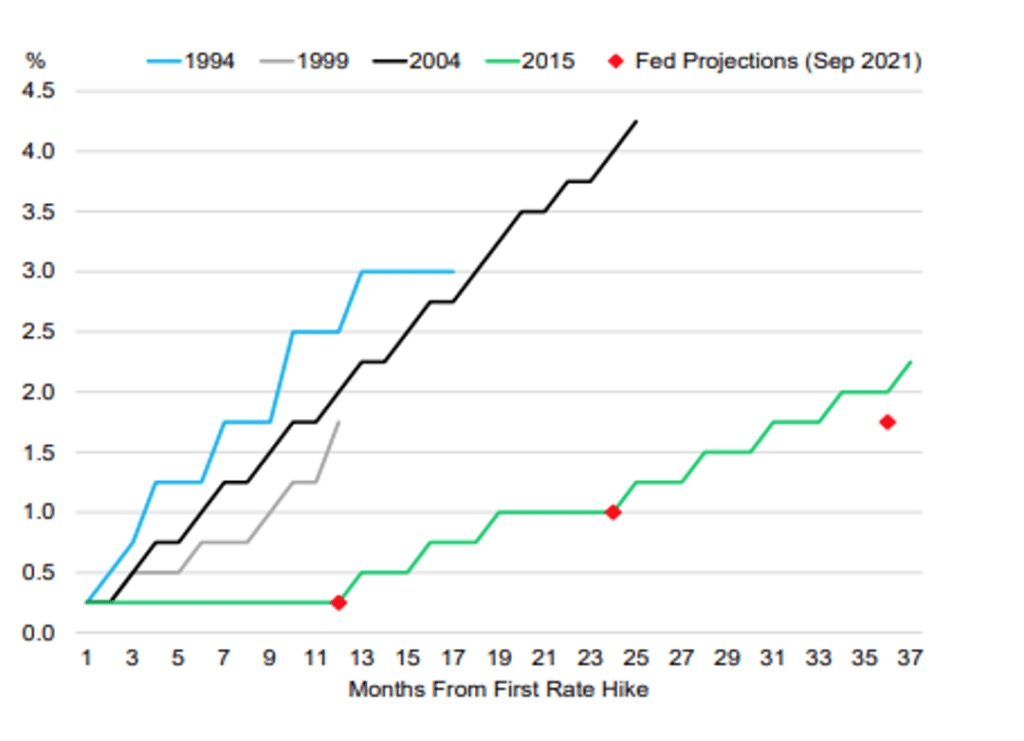
The latest FOMC projections point to a slow rise in the Fed Funds rate starting in 2023, reaching 1% by the end of 2024 and topping out at 2.5% in the long run, according to the median of Fed forecasters. If realised, this path for policy would be similar to the 2015-18 cycle, which was the slowest policy cycle ever and stands out relative to the prior three cycles (Chart 2).
Chart 2: Fed policy cycles compared (cumulative tightening through cycle)
 In July, we suggested that low rates priced into forwards at the time would likely be challenged in the following months by improving economic data. That has started to come through over the last few weeks, with 2y and 3y ahead Fed rate expectations rising by up to 30bp. However, the gap between the market and the Fed’s outlook remains significant at the long end of the curve, reflecting the impact of flows into long term bonds and investor scepticism about the prospect of higher neutral policy rates. At current levels, the market is still pricing a sustained negative real interest rate over the long run, a significant source of comfort for equity markets.
Global rate paths starting to diverge
At the onset of Covid in 2020, central banks and governments moved in near lockstep to ease monetary and fiscal policy. With the recovery now well underway and global vaccination rates elevated, greater differences are emerging between economies in terms of progress towards closing output gaps and reaching inflation targets. These differences are likely to grow further over the coming months and years, reducing the yield correlation across markets and driving greater spread variation, particularly at the shorter end of curves. This divergence is now showing up in short term market pricing for cash rates.
Looking beyond the Fed, we note the following recent changes in policy and outlook by various central banks:
- The Norges Bank and RBNZ recently became the first two developed market central banks postCovid to hike policy rates. The front end of both curves are priced for significant further tightening. The RBNZ have called the decision a “least regrets” approach and the Bank’s projections assume the cash rate rises to over 2% by 2023, when some other central banks are talking about just beginning a tightening cycle.
- The Bank of England recently cited inflationary pressures and a tighter labour market in a hawkish statement after the September policy meeting. QE is expected to end in December, while the market and many forecasters look for rate hikes early in 2022.
- The Bank of Canada is signaling rate hikes are coming in the second half of 2022.
- The RBA is tapering QE but suggesting in speeches and policy statements that inflation and wages conditions for rate hikes are unlikely to be met until 2024. However, the market is pricing a similar path for the RBA and Fed, with some tightening priced in for late 2022 and more meaningful hikes through 2023.
- The ECB are further than other central banks (aside from the BoJ) from reducing QE and hiking rates and some forecasters don’t see hikes until 2025. Rising inflation sees the market price risk of hikes in 2023-2024.
Rising macro uncertainty at odds with low rates volatility
The Fed and other global central banks have signalled an end to the extraordinary period of post-Covid policy easing. However, the exit may not be a smooth process and is at risk of set-back on multiple fronts.
The base case assumed by markets is that global growth has peaked but will sustain healthy momentum. Confidence in the outlook is boosted by signs of falling delta variant case numbers, rising vaccination rates and easing social distancing measures in major economies. Easy financial conditions are also continuing to boost confidence.
There are, however, significant macro uncertainties confronting investors. Just as central banks are pulling back on stimulus, fiscal support will also be incrementally reduced through 2022, by varying degrees across economies. In addition, the last month has seen a more intense focus by investors on inflation risks. Key energy price and commodity benchmarks have surged, while supply side pressures in many product markets persist.
There are good reasons to believe these effects won’t last. Indeed, the watchword for investors in 2021 is “transitory” inflation, but just how that is quantified is open to interpretation. The longer price pressures persist, the greater the conundrum facing central bankers grappling with associated growth and credibility risks.
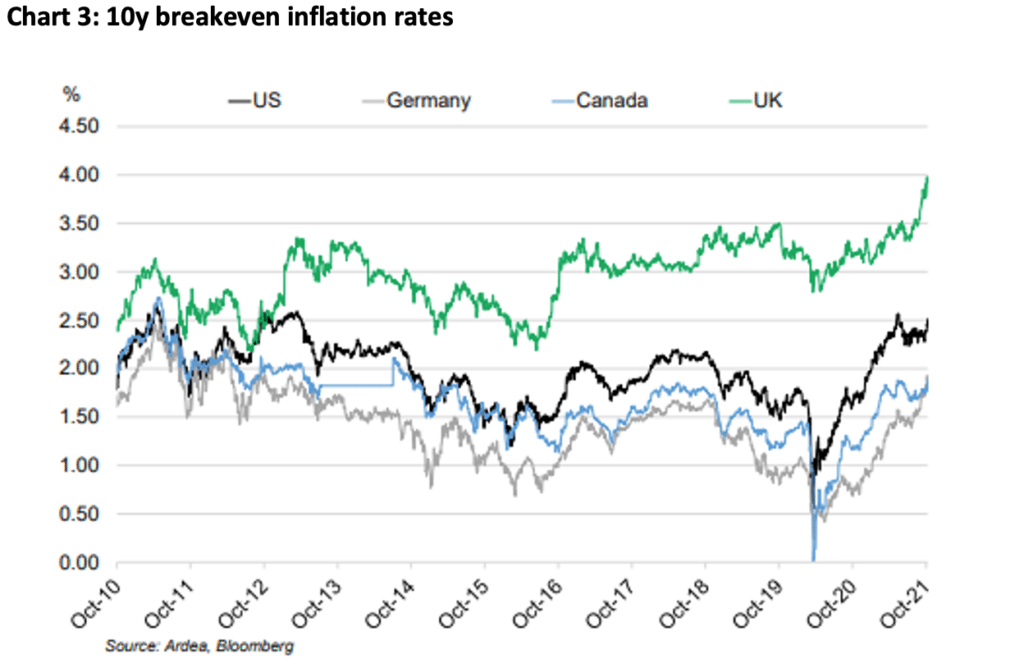
Some central banks are clearly more concerned than others with rising inflation. The BoE is a case in point, as goods and labour shortages and high energy prices have seen inflation expectations jump sharply. The UK 1y inflation (RPI) swap has lifted around 2.5% since Q2 to reach just over 6% last week and the market is pricing retail price inflation to average over 4% for the next 5 years (note this retail price index is structurally higher than CPI, but the pace of the recent increase is still significant).
Chart 3 shows market-based inflation expectations have jumped again across Europe, the US and UK especially. The inflation curves are inverted and are ultimately pricing a moderation in inflation towards central bank targets. In previous notes on inflation, we argued that inflation tail risks have grown significantly relative to the path assumed by yield curves.
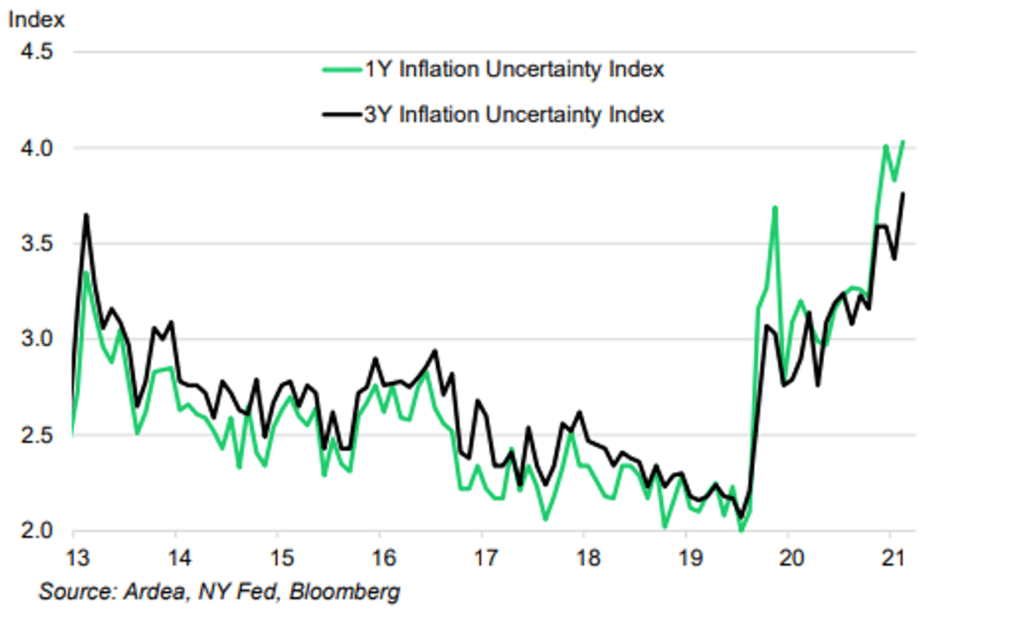
Other measures of inflation uncertainty have doubled, as Chart 4 shows (these indices track US consumer expectations).
Chart 4: US inflation uncertainty indices
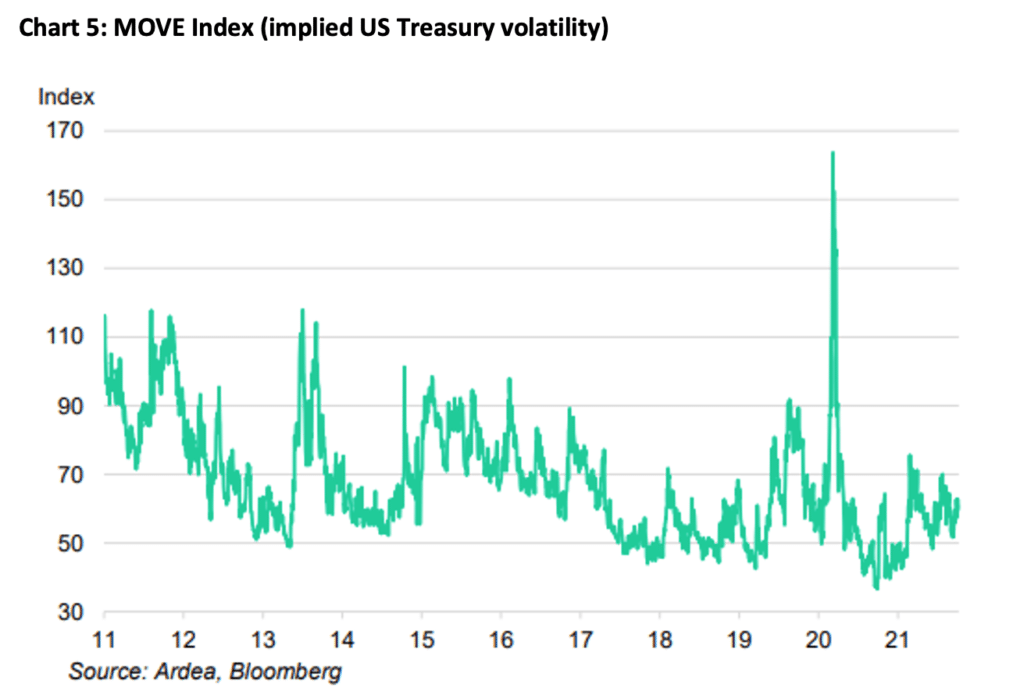
Notwithstanding the recent jump in bond yields and a few brief wobbles in equities, the market has taken the outlook for tighter monetary policy and a range of other risks in its stride. Even if the market can absorb tapering far better than in 2013, the approach of tighter policy settings amid elevated growth and inflation uncertainty is likely to challenge the still low level of bond market volatility (Chart 5).
This material has been prepared by Ardea Investment Management Pty Limited (ABN 50 132 902 722 AFSL 329 828) (Ardea). It is general information only and is not intended to provide you with financial advice or take into account your objectives, financial situation or needs. To the extent permitted by law, no liability is accepted for any loss or damage as a result of any reliance on this information. Any projections are based on assumptions which we believe are reasonable but are subject to change and should not be relied upon. Past performance is not a reliable indicator of future performance. Neither any particular rate of return nor capital invested are guaranteed.


 Platform To Digitally Trade Corporate Bonds")


