


By Ares Australia Management
Market dislocations have become shorter and more frequent since the Global Financial Crisis (“GFC”), also referred to as the Great Recession.
The GFC along with prior dislocations, lasted two or more years. However, in March 2020 after COVID-19, the market retraced in just six months.
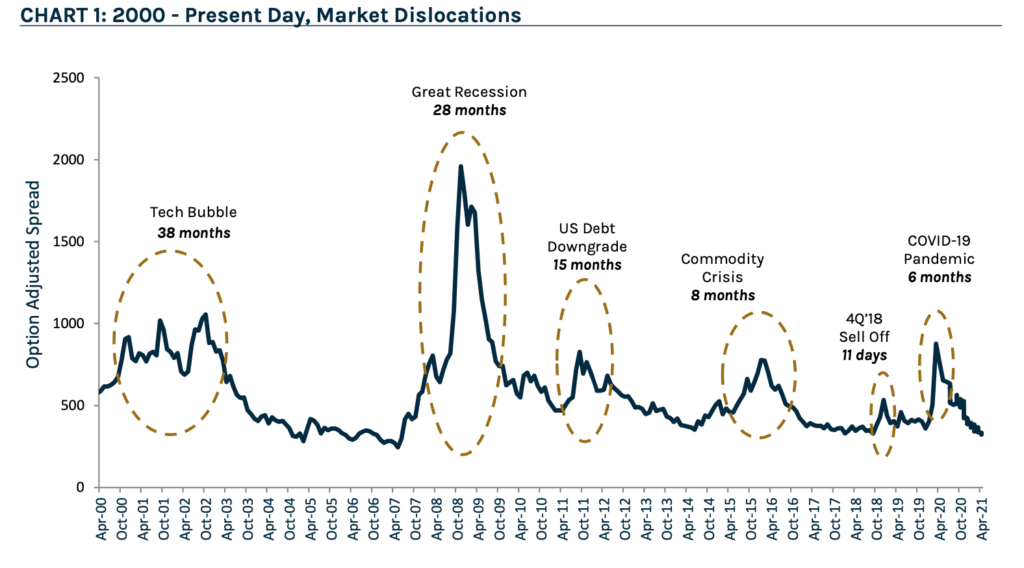
Note: As of April 14, 2021. Represents opinions of Ares’ investment professionals only and should not be construed as investment advice. For illustrative purposes only. Dislocation defined as periods when high yield OAS increased above ~700 before returning to historical median of ~500. Source: The BofA US High Yield Master II Constrained Index (“HUC0”) OAS from January 1, 2001 through April 14, 2021. Please refer to endnotes for Index Definitions and an important index disclosure.
2020: A Banner Year for Relative Value Investing
2020 was a complex, tumultuous year for global financial markets. We believe there was no single “trade”, as managers had several opportunities to generate excess return through active asset rotation and disciplined credit selection.
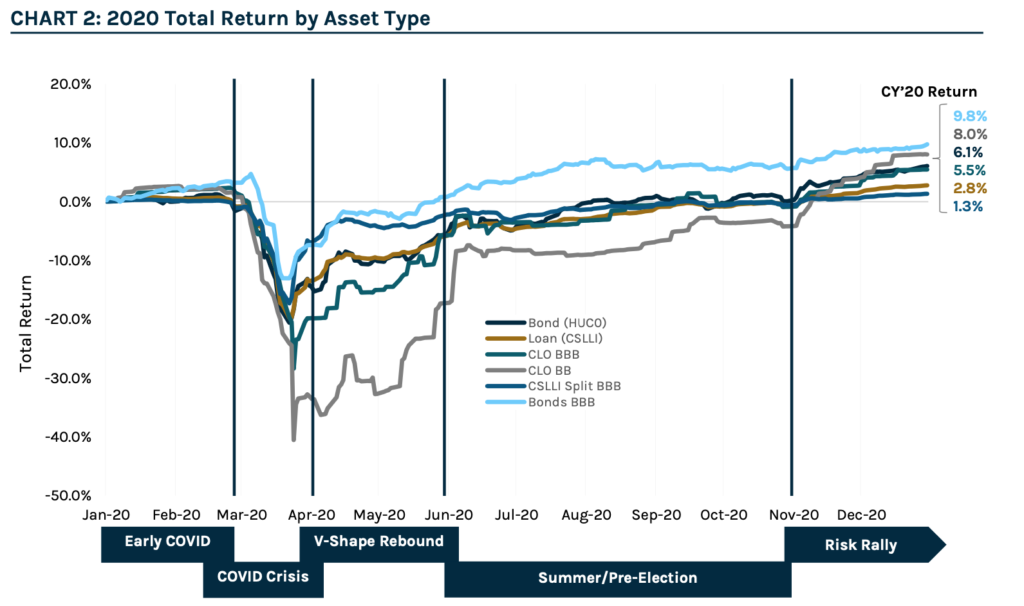
Source: ICE BofA HY Index, Credit Suisse, JPM. Data as of December 31, 2020. The time periods shown were selected to illustrate the performance of various market environments during 2020, and may not capture all market scenarios during this time period. An investor cannot invest directly in an index. Please see endnotes for Index Definitions.
At Ares, we actively repositioned our multi-asset credit portfolios as market conditions evolved throughout the year and were able to capitalize on air pockets of volatility and capture relative value opportunities.
Below is a summary of notable market themes during each of the periods illustrated above, and how we positioned our portfolios accordingly.
- Early Covid: After a strong start to the year, credit markets came under pressure in early March, as COVID-19 began to spread outside of China to the United States and Europe. As a result of elevated volatility, the Federal Reserve (“the Fed”) pre-emptively cut interest rates to near zero. In February, we raised cash across portfolios as COVID-19 became more serious to be well- positioned to buy any oversold investment opportunities.
- Covid Crisis: The global pandemic drove an economic standstill and as a result, global financial markets experienced a severe downdraft in late March. Amid heighted volatility, we rotated up in quality into high grade corporate debt, which sold off alongside sub-investment grade credit amid indiscriminate selling.
- V-Shape Rebound: Risk assets rallied as asset prices were buoyed by unprecedented stimulus from the global central banks. We took profits on our high-grade corporate debt exposure and rotated into investment-grade collateralized loan obligation debt securities given the long-run total return potential for the asset class and a yield premium to similarly rated corporate debt. While structured credit lagged the recovery seen in high yield bonds and bank loans, the asset class continued to make substantial gains since March lows amid improving technicals.
- Summer / Pre-election: Credit markets remained resilient and spreads continued to tighten while default expectations improved, as accommodative fiscal and monetary support overshadowed rising COVID-19 infection rates and elevated U.S. Presidential election uncertainty. We remained overweight corporate bonds and underweight loans, as bond technicals remained supportive amid strong primary issuance, fund flows and the Fed’s backstop.
- Risk Rally: The significant rebound from March lows continued as election and vaccine related optimism lifted investor sentiment, despite the resurgence of COVID-19 cases and social unrest. Most credit sectors traded at or inside pre-pandemic levels by year-end. Within our below investment-grade corporate debt exposure, we rotated into bank loans, as the asset class screened more attractive on a relative value basis than bonds, given their short duration, convexity profile and senior secured spread. In addition to the attractive yield, loans offer protection against both potential rising interest rates and a potential stalled recovery given the security of the asset class.
Over the course of 2019, 2020 and 1Q’21, the market presented very different investment environments. As illustrated below, during each of these periods, Ares was able to consistently outperform both broad market indices and larger ETFs in the loan and high yield sectors, underscoring the importance of a dynamic approach across asset classes as well as active management within each of those sectors.
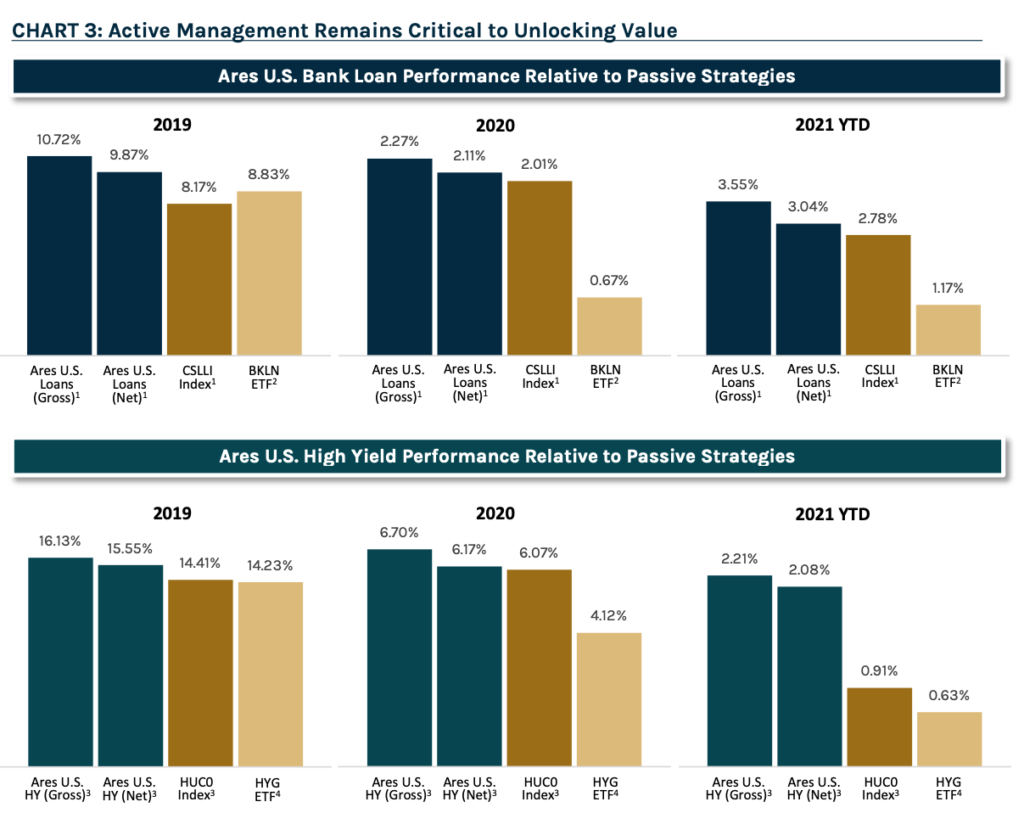
Source: ICE BofA Indices, Credit Suisse Leveraged Loan Index, as of March 31, 2021. Past performance is not indicative of future results. As with any investment there is always the potential for gains as well as the possibility of losses. For illustrative purposes only. Please see endnotes for Index Definitions, an important index disclosure and for performance notes.
Our agile approach in 2020 underscores the importance of a dynamic and flexible approach to capture relative value opportunities across the global credit markets. For more information please see https://www.fidante.com/investment-managers/ares-australia-management
Index Definitions
Credit Suisse Leveraged Loan Index (“U.S. Bank Loans”) is designed to mirror the investable universe of the $US-denominated leveraged loan market. The index inception is January 1992. The index frequency is daily, weekly and monthly. New loans are added to the index on their effective date if they qualify according to the following criteria: 1) Loan facilities must be rated “5B” or lower. That is, the highest Moody’s/S&P ratings are Baa1/BB+ or Ba1/BBB+. If unrated, the initial spread level must be Libor plus 125 basis points or higher. 2) Only fully-funded term loan facilities are included. 3) The tenor must be at least one year. 4) Issuers must be domiciled in developed countries; issuers from developing countries are excluded.
Credit Suisse Leveraged Loan Index Split BBB is a subset of the CSLLI and includes only split BBB issuers. It uses a single “blended” Moody’s/S&P rating to compute averages sorted by rating. Excludes split B because the split B loan index is heavily represented by one single corporate issuer.
JP Morgan U.S. CLO BBB Index tracks floating-rate CLO securities in 2004-present vintages, rated BBB. Additional sub-indices are divided by ratings AAA through BB, and further divided between pre- and post-crisis vintages. CLO 2.0, or post-crisis vintages, include deals issued in 2010 and later. CLOIE utilizes a market-value weighted methodology. Inception date: July 15, 2014.
JP Morgan U.S. CLO BB Index tracks floating-rate CLO securities in 2004-present vintages, rated BB. Additional sub-indices are divided by ratings AAA through BB, and further divided between pre- and post-crisis vintages. CLO 2.0, or post-crisis vintages, include deals issued in 2010 and later. CLOIE utilizes a market-value weighted methodology. Inception date: July 15, 2014.
The BofA US High Yield Master II Constrained Index (“HUC0”) tracks the performance of US Dollar denominated below investment grade corporate debt publicly issued in the US domestic market with a maximum issuer exposure of 2%. The returns of the benchmark are provided to represent the investment environment existing during the time period shown. For comparison purposes the index includes the reinvestment of income and other earnings but does not include any transaction costs, management fees or other costs.
The ICE BofA BBB US Corporate Index “C0A4”, a subset of the ICE BofA US Corporate Master Index tracking the performance of US dollar denominated investment grade rated corporate debt publicly issued in the US domestic market. This subset includes all securities with a given investment grade rating BBB. When the last calendar day of the month takes place on the weekend, weekend observations will occur as a result of month ending accrued interest adjustments.


")


 Platform To Digitally Trade Corporate Bonds")