


Part of an insight article from Ardea Investment Management.
1Q22 saw a historically large sell-off of bonds. A lot of policy tightening is now priced in but there are still substantial risks to the outlook for bonds.
Historically poor quarter for bonds
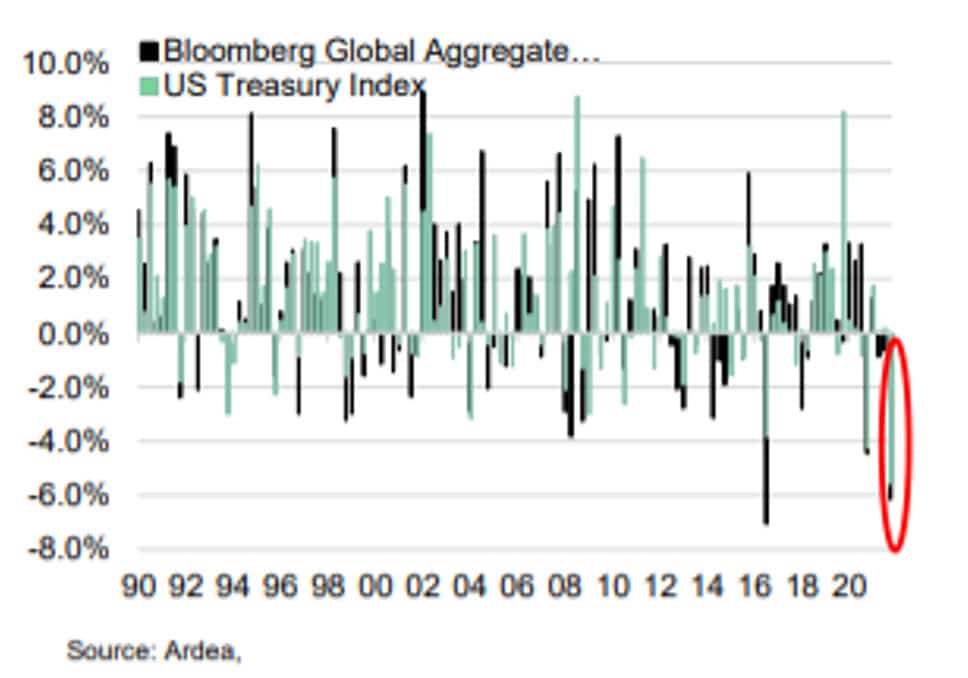
Sovereign bonds underperformed significantly in March, capping off an historically poor quarter for returns. For the Bloomberg US Treasury (-5.6%) and AusBond Composite Bond (-5.9%) indices, Q1 2022 was the worst quarterly outcome in over 30 years. It was the second-worst quarter for the broader Bloomberg Global Aggregate Index (- 6.2%).
Chart 1: Bond index quarterly returns
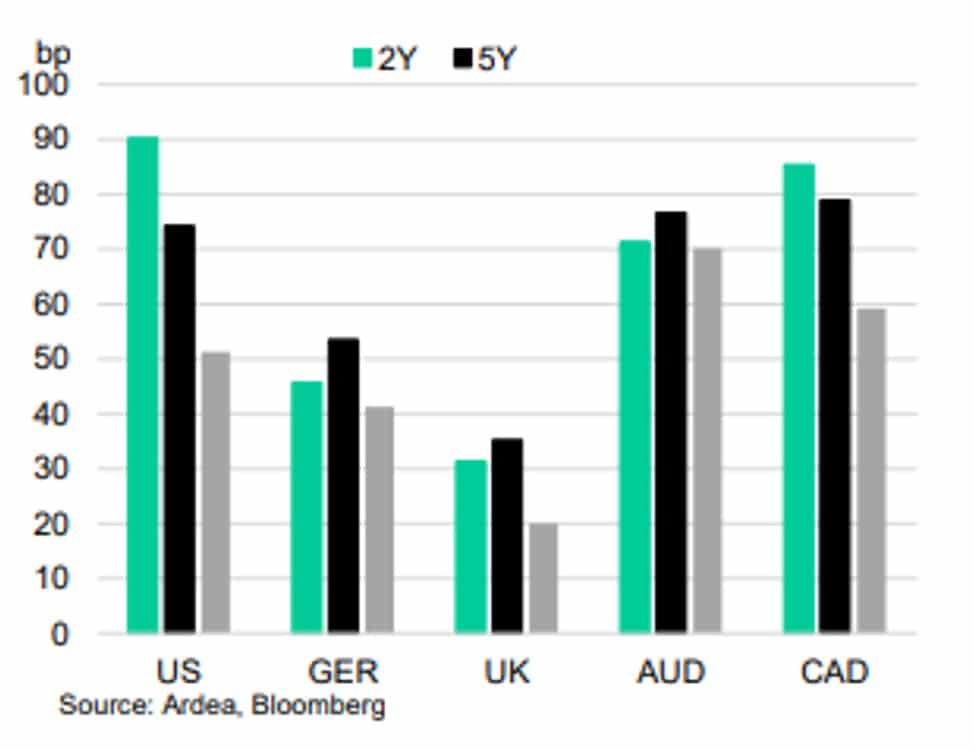
Bond yields surged higher, led by the US market, as central banks reacted to the relentless rise in inflation. Shorter-dated bonds led the sell-off, as markets priced for both a faster pace of tightening and higher terminal policy rate in the next cycle. The rise in yields has extended further in early April. Central banks and investors are grappling with headline inflation running at a 40 year high in the US (+7.9%) and in Europe (+7.5%) at the highest level in the history of the single currency.
Chart 2: March monthly Change in sovereign bond yields
The Russian invasion of Ukraine had driven risk-off moves across markets and higher commodity prices. While geopolitical risks remain in focus for investors and commodities are still volatile and elevated, equities have recovered in recent weeks.
Rates repricing – throwing away the post-2008 rulebook
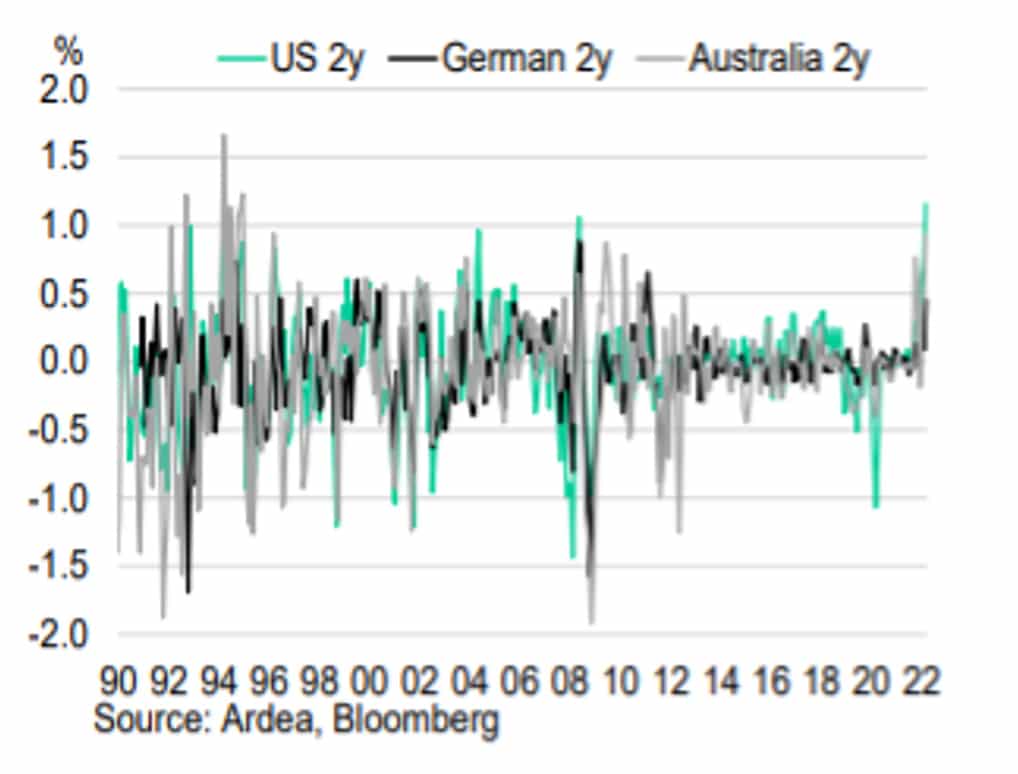
The shift higher in rates over the last few months has been front-end led. Building on earlier moves, 2y yields have seen among the largest 3 month increases since the 1990s in the US, Germany and Australia (Chart 3).
Chart 3: 3m change in 2y yields
The extension of the rise in yields in March and April follows three main developments:
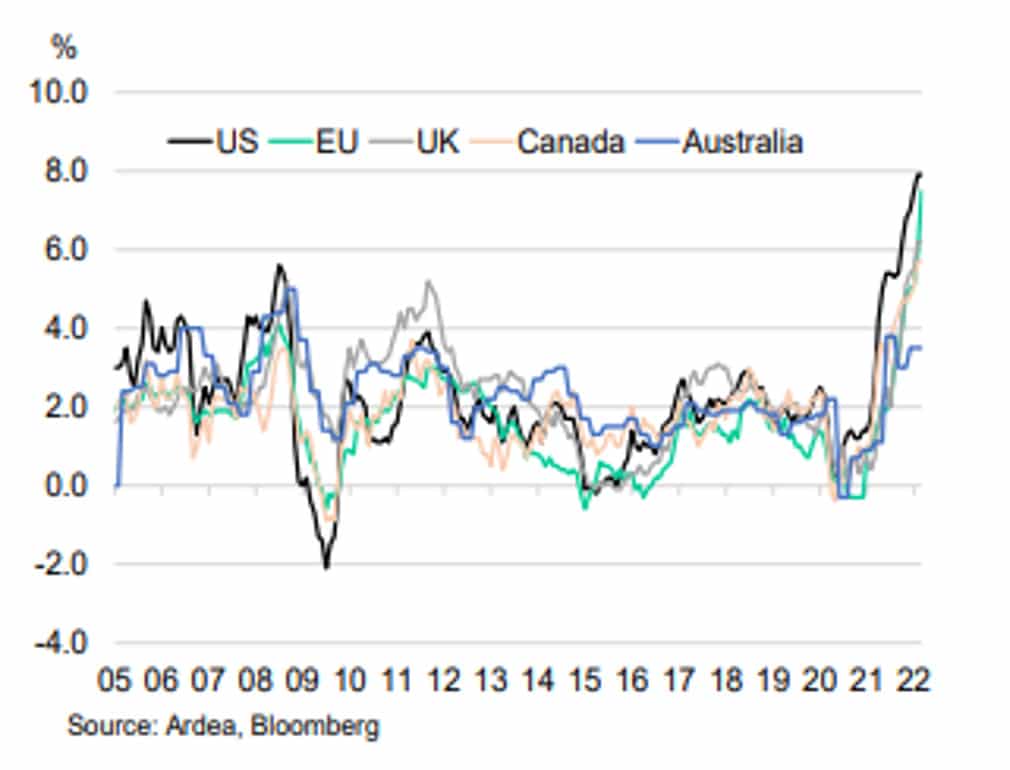
1) Global inflation continuing to rise (Chart 4)
2) The Fed openly flagging 50bp rate hikes at successive meetings
3) The Fed outlining a faster plan for Quantitative Tightening (QT)
Chart 4: Headline CPI
After delivering the first 25bp hike of the cycle in March, the Fed has signaled a willingness to hike in 50bp increments at upcoming meetings. The front end of the US curve is now priced for a peak in the Fed Funds rate of over 3% within just over a year. As Chart 5 shows, this pricing implies a far more aggressive tightening cycle than in 2015-18 and would take the key policy rate back to levels unseen since prior to 2008.
Chart 5: Prior Fed Funds tightening cycles and current market pricing – 1st hike to peak
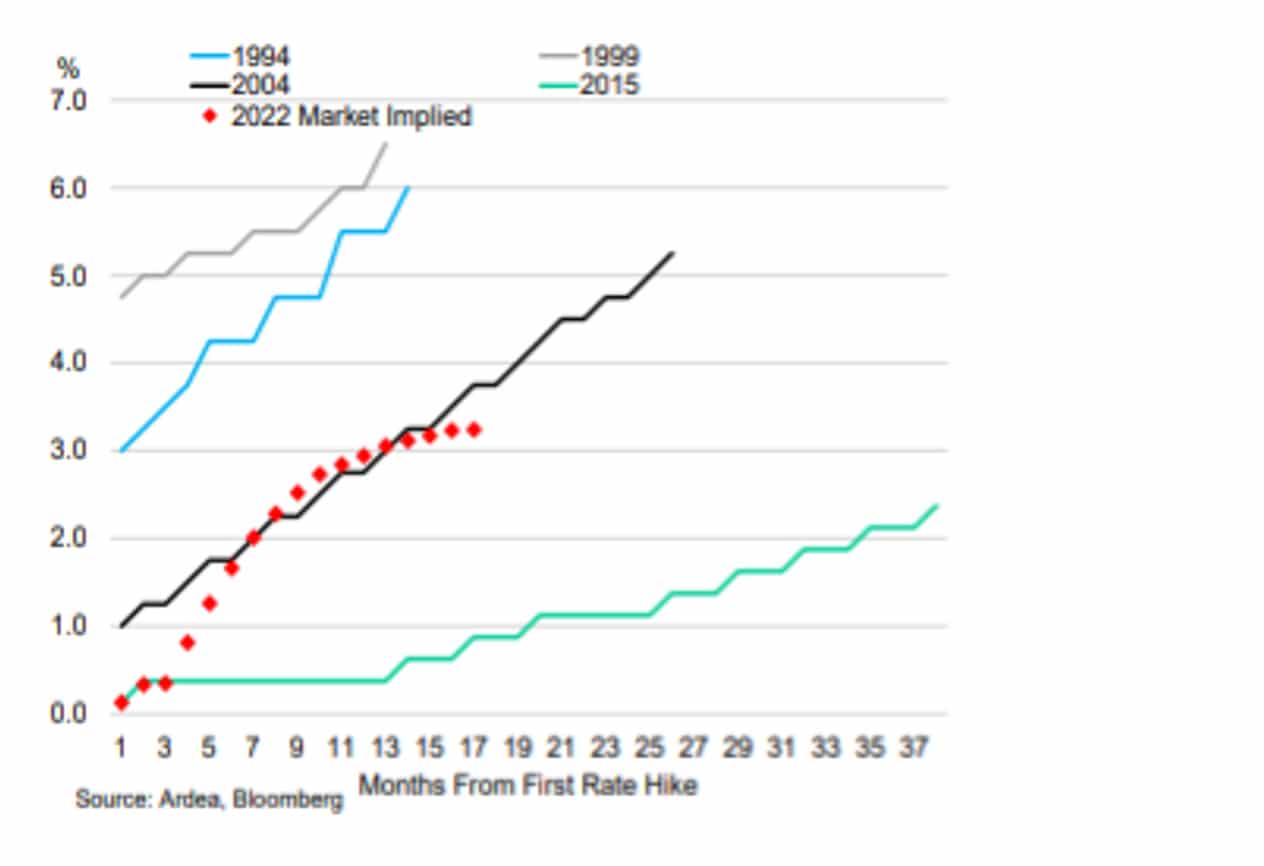
Other markets are similarly pricing policy rates to be raised quicker and to a higher level than at anytime since prior to 2008. The Bank of Canada, like the Fed, is expected to hike in 50bp increments. The Bank of England – having already raised rates 65bp since December 2021 – is priced to take the base rate to 2.5% over the next year.
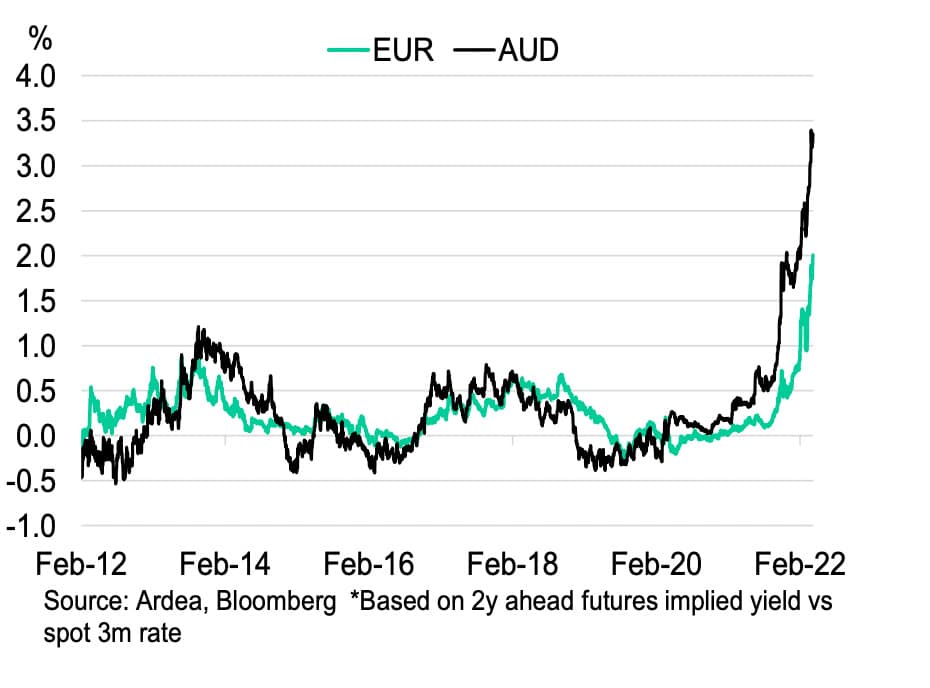
In early April, the RBA opened the door to commence lifting rates sooner (Chart 6).
Chart 6: 2y ahead rate priced for EUR and AUD
Beyond rate hikes, central banks are also signaling a reduction in balance sheet size. The Fed’s March minutes revealed plans to cap the size of the monthly runoff of bonds from the portfolio at $95bn after a brief phase in period. This planned reduction in balance sheet size – or Quantitative Tightening (QT) – is around twice the pace seen in the last cycle. However, given the massive size of post-Covid QE, the faster run-off would still see the Fed’s asset holdings at prepandemic levels at the end of 2024.
QT is a passive process, so the impact on bond yields should be less dramatic than QE. There are implications for term risk premia and the shape of yield curves, but this also depends on the net flow of bonds (after adjusting for issuance). QT is still another bearish headwind for the market and over the last few weeks has added steepening pressure to the curve.
Is the worst over for bonds?
After such a big repricing in a short space of time, bonds could soon start to consolidate. However, we may not yet have seen the peak in yield levels – typically this has occurred well into tightening cycles. Also, unlike other bond sell-offs over the last decade, investors and central banks do not have confidence that inflation risks are contained.
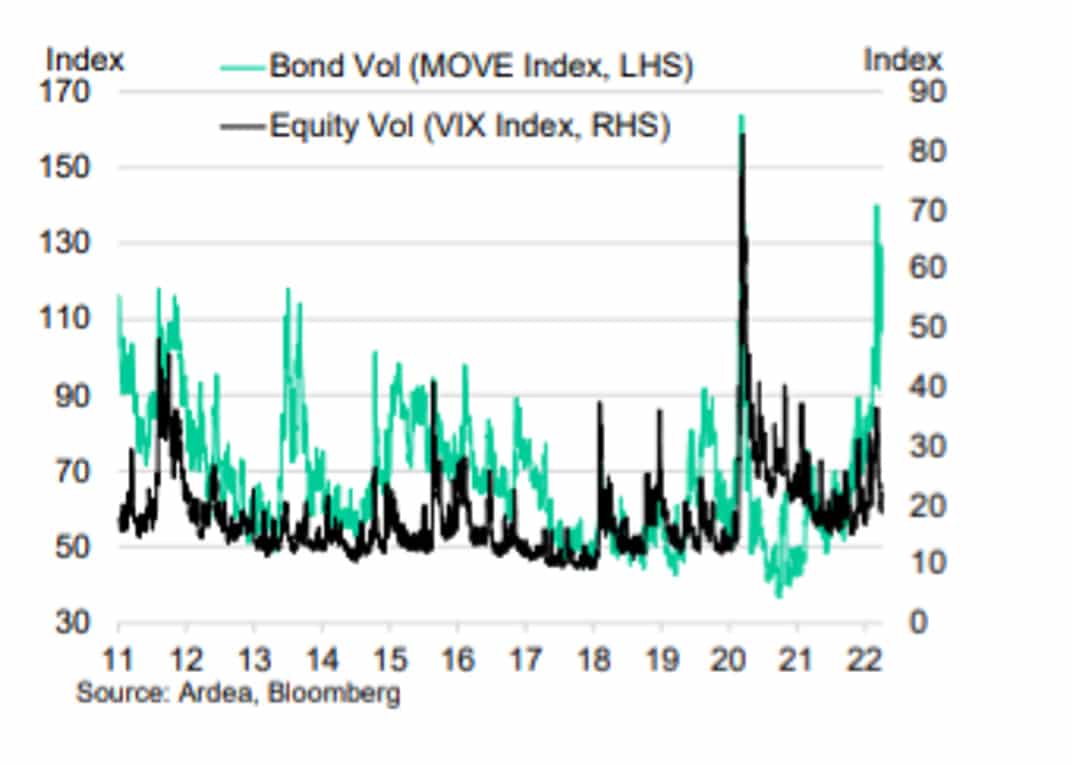
Yields could make new highs until inflation data turns lower or tighter financial conditions meaningfully weigh on growth (a risk starting to be factored into longer run rates with yield curves flat and recently inverting). In addition, real yields are still historically low and bond volatility is high (Chart 7).
Chart 7: Option implied volatility in bonds and equities
Please click here to read the full article.


")


 Platform To Digitally Trade Corporate Bonds")


