


A yield curve shows the relationship between interest rates and the term to maturity. It plots interest rates on the y-axis and term to maturity on the x-axis.
Importantly, interest rates should be taken from the same credit quality issuer and the same currency, as these other factors will influence interest rates.
One of the most commonly referenced yield curves is for government bonds, where governments issue many securities over many years, making yield curves easy to construct with multiple data points.
The yield curve is the market’s current view of interest rates for various terms to maturity. But it can also be used to determine the market’s current view of future interest rates.
Normal or Positive Yield Curves
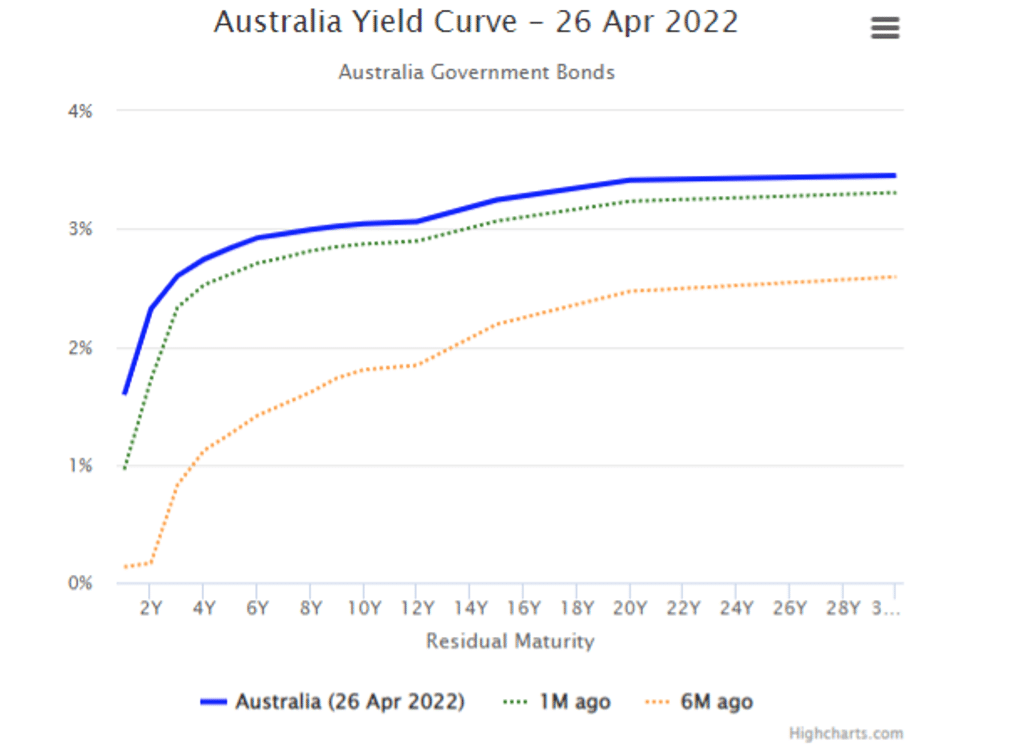
The Australian government bond yield curve is shown in the example below. The blue line shows the curve as at 26 April 2022, while the green dotted line represents the curve a month ago and the orange dotted line, six months ago.
We can see that interest rate expectations are rising very steeply out to two years, then the curve is less steep out to six years, where it begins to flatten out.
This example is known as a ‘normal or positive yield curve’, where investors are paid more for investing for longer. This is intuitive as investors expect to be paid more for committing to longer terms where there is greater uncertainty.
Fixed rate bond prices decline under normal yield curve conditions as interest rate expectations rise. Floating rate notes (bonds) show greater price stability and coupons (interest payments) rise as they are linked to a benchmark that is typically revised on a quarterly basis.
Negative or Inverted Yield Curves
If the yield curve is negative or inverted, the market expects interest rates to decline as time progresses. So, expected shorter term interest rates are higher than longer term interest rates. Under these circumstances, investors would look to lock into higher current interest rates by investing in fixed rate bonds. If interest rates decline as the yield curve forecasts, than fixed rate bond prices would rise, delivering higher than expected gains.
ALSO READ: Bonds Under Pressure – Is The Worst Over?
Inverse yield curves usually occur when the central bank is aggressively tightening monetary policy to try and slow the economy and contain inflation.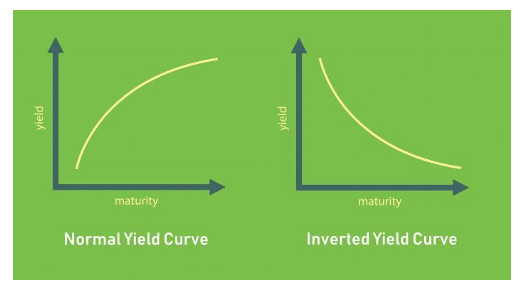
Why does a negative yield curve matter?
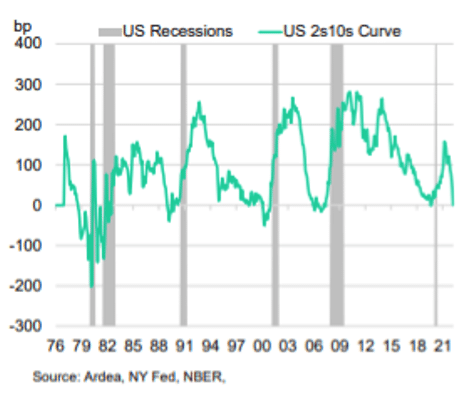
A negative government bond yield curve can forewarn of an impending recession. The majority of US recessions over the last 70 years have followed the inversion of the US two and ten year curve.
The US 2s10s Curve and US recessions


")


 Platform To Digitally Trade Corporate Bonds")