


From Barwon Investment Partners a specialist fund manager investing in alternative assets across Healthcare Property, Property Finance and Global Investments.
Private Credit covers a range of different lending activities (direct lending; distressed credit; mezzanine debt; special situations; venture debt; opportunistic credit; real estate and infrastructure credit).
This note focuses on direct lending to middle market corporates, an area of investing which is new to many Australian investors whose portfolios, if they’ve included direct lending at all, have typically been exposed to mortgages or property-related debt. Private Credit is going to become a mainstay of Australian investors’ portfolios, middle market loans in particular, and this note focuses on the risks and returns of this segment of the Private Credit markets.
Key Features
The key features of direct loans to middle market corporations are:
▪ Loans are directly originated by the lender and are bilateral between the lender (the Private Credit Fund) and the borrower (a middle market corporation). The loans are not syndicated by an intermediary such as a bank. The loans are not sold off and traded publicly as is the case for High Yield Bonds and Broadly Syndicated Loans.
▪ Interest Rate: typically benchmarked to a floating rate benchmark, normally Secured Overnight Financing Rate (SOFR) plus a margin of 4% – 6%. Interest rate terms are also normally subject to a floor, often 1% plus the spread, meaning investors get the benefit of rate rises but are protected from rate falls beyond the floor level.
▪ Security: senior in the capital structure or unitranche (a single loan that effectively is a combination of senior and subordinated debt).
Middle Market Loans, Broadly Syndicated Loans, and High Yield Market Characteristics
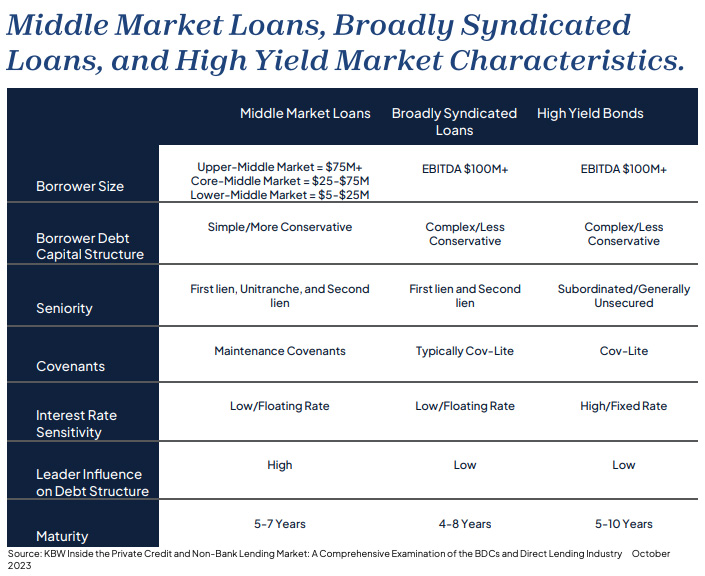
There is no single definition of what constitutes the ‘middle market’ but, in general, it refers to the part of the market that is typically financed by direct, or non-bank, lenders. In other words, it refers to companies that do not have ready access to the publicly traded High Yield Bond or Broadly Syndicated Loan markets.
Also read: Why Increasing Dispersion Favours Active Management In High Yield
In terms of EBITDA, companies with EBITDA between $5-$100 million are generally considered ‘middle market’ with the lower middle market being $5-$25 million EBITDA, the core middle market being $25-$75 million EBITDA and the upper middle market being $75 million plus.
Sponsored vs Unsponsored
The majority of corporate loans made by private credit funds are made to sponsored transactions. A sponsored transaction involves an equity investment by a private equity firm (a financial sponsor). Barwon has been investing in Private Credit since 2007 and over that time we’ve seen the advantage of loans made to financially sponsored or private equity backed companies. Most recently, we saw this during COVID where private equity deal sponsors and Private Credit managers worked collaboratively to keep afloat companies which were severely impacted by the pandemic. Many companies in the travel and hospitality sectors, for example, were kept afloat by private equity managers contributing to ‘top up equity’ in return for covenant relief and sometimes additional funds from their lenders.
Returns
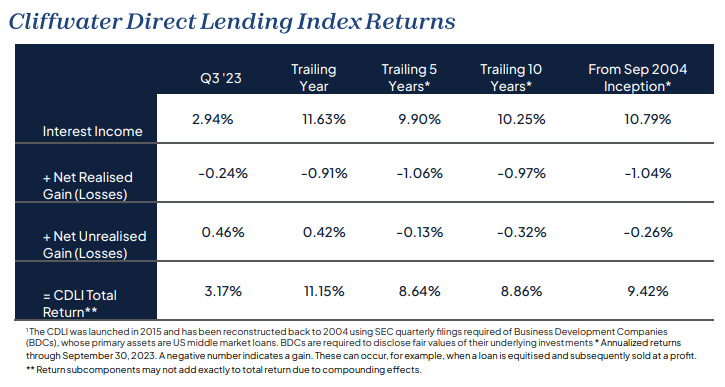
With hold-to-maturity loans (and any debt security), a key determinant of returns is credit losses. The market value of a loan might fluctuate during a holding period, but the ultimate return is always a function of the interest and capital repayments received less any credit losses. Credit loss data is notoriously hard to get. Even with publicly traded rated debt, credit loss data is notoriously difficult to obtain. The rating agencies like S&P and Moody’s publish default data. But a financial default only indicates when a company has failed to make a financial payment on time. It does not necessarily mean a payment is never made. Losses given an event of default can vary significantly. Cliffwater, a Los Angeles-based alternative investment management firm, has done private credit investors an immense favour by creating the Cliffwater Direct Lending Index (CDLI). The CDLI is an asset-weighted index of approximately 14,000 directly originated middle market loans totaling $295 billion as at September 2023. Importantly, the CDLI has been constructed from publicly reported information and does not suffer from problems of survivorship bias or self-selection1 . As such, it provides an unbiased picture on the performance of middle market private credit. From September 2002 the CDLI has produced an annualised return of 9.42%. This return is unlevered and gross of fees.
Realised Loss Rates and Risks
Realised loss rates since inception of the CDLI are 1.04% p.a. What does this indicate about the riskiness of Private Credit? By itself, not very much. Loss rates need to be considered in the context of returns. A loss rate of 1% p.a. on a portfolio yielding 5% p.a. is very different to the same loss rate on a portfolio yielding 10% p.a. However, a gross return yield of 10.79% and a net return of 9.42% p.a., which is the return of the CDLI since inception, is an outcome most investors would consider very desirable.
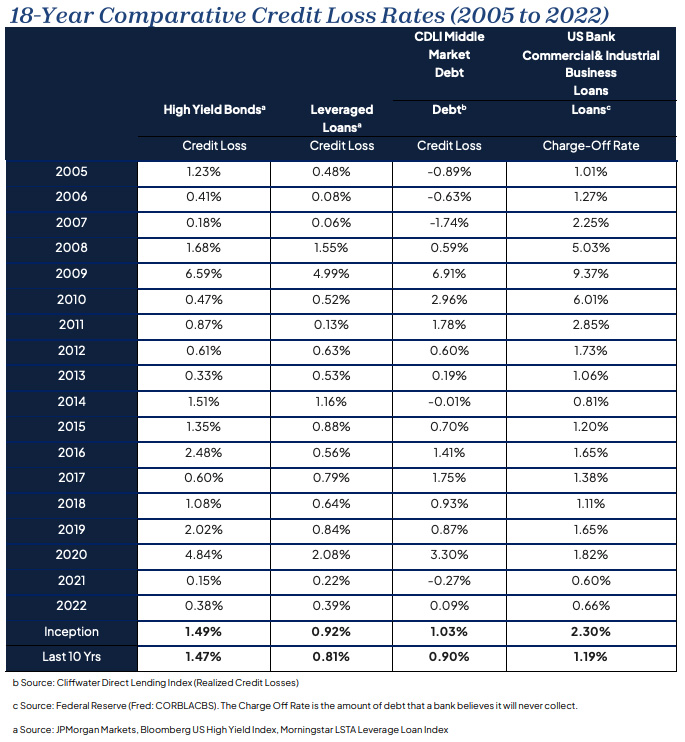
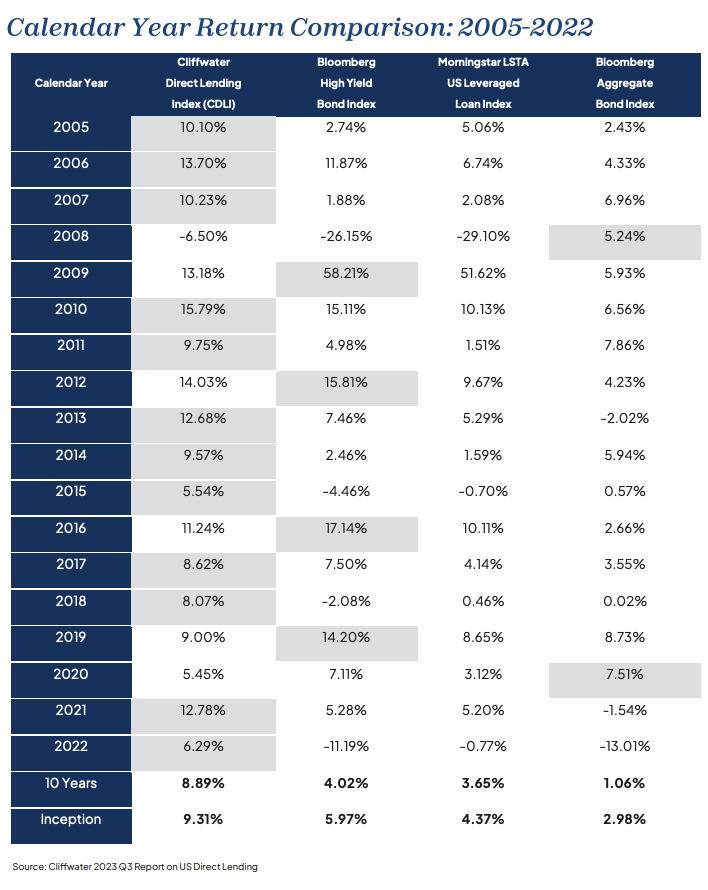
The table below compares the CDLI calendar year returns to high yield bonds, syndicated loans, and investment grade bonds.
Analysis
Publicly traded High Yield Bonds and Leveraged Loans typically involve larger companies. You would expect, therefore, that the credit loss experience for HYBs and LLs would be significantly lower than for the CDLI, but this hasn’t been the case.
We speculate that one of the major reasons CDLI credit losses are lower relates to the advantages of lending to private equity sponsored companies as mentioned above. Anecdotally, we regularly hear of buyout managers renegotiating loan terms when an underlying investment breaches a technical or financial covenant. It is quite common for loan terms to be ‘amended and extended’ in return for some top-up equity from the private equity firm that provides an investment and the lender with the additional ‘headroom’ to recover value.
Credit Losses Can Be Episodic
Averages can be very concealing when it comes to credit losses.
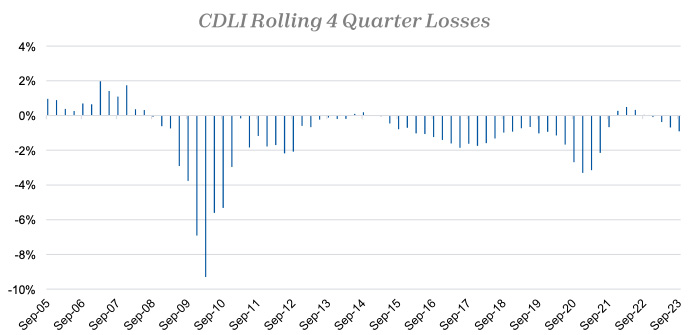
They can conceal moments in history when credit losses are deep and painful. The graph below shows the periods of deepest credit losses:
▪ The GFC (March 2010, -9.3%)
▪ The oil price collapse from 2014 to 2016 (-1.86%, June 2017)
▪ COVID-19 (-3.30%, December 2020)
Again, Cliffwater have provided some excellent comparative analysis:
Returns of Private Credit vs Other Corporate Loans
Analysis
Even through these peak credit loss periods, the only calendar year in which the CDLI delivered a negative total return was 2008 (-6.5%).
The profile of the loans underlying the CDLI in 2008 was quite different to today. Back then, approximately only 45% was in senior loans with the balance in subordinated debt and equity. Today, the weighting to senior debt is considerably higher at circa 75%. This suggests that if the GFC were to happen today, the credit losses sustained might be lower than in 2008. Whatever the case, we would argue that a -6.5% total return performance against the backdrop of the GFC, is surprisingly strong performance.
Against the other public debt indices, the CDLI has outperformed in 12 out of 18 calendar years. The CDLI has only had the one year of negative performance, 2008 (-6.5%), and has consistently delivered stronger total returns than the other benchmarks.
Furthermore, not all loans and private credit funds are created equal – we have witnessed substantial dispersion in terms of credit loss experienced among the private credit managers we have followed over the last 17 years. While the average loss rate has been 1.04% p.a., among the top performing managers, the realised credit loss experienced has been substantially lower; for example, Golub Capital has annual loss rates from payment defaults of just 0.01% since 2004.
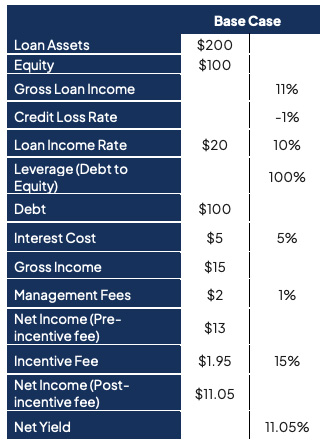
In terms of interpreting these results, we note that the CDLI is an index of loan performance, not an index of returns to investors. Investors will not typically access the returns to the underlying loans directly and so those returns will be impacted by fees (typically (1.0% – 1.5% of assets and 15% – 20% of net operating income subject to a hurdle of 6% – 8% p.a.) and leverage at the fund level. Some private credit funds are unleveraged but many employ leverage (commonly 1:1 debt to equity). The table below shows the returns to a fund with some typical terms and a debt-to-equity ratio of 1:1.
Summary
Middle market corporate loans have generated very strong risk adjusted returns. Even though the most dramatic credit events (the GFC and COVID) middle market corporate loan performance has been very resilient and superior to other assets such as High Yield Bonds, Broadly Syndicated Loans and Treasury Bonds.
Australian investors can now access middle market corporate loans through loan funds managed by the likes of Ares, Blackstone, Golub, and Carlyle Group through funds listed on the New York Stock Exchange or through a growing number of unlisted ‘semi-liquid’ fund structures.
Barwon offers two funds providing access to private credit:
▪ The Barwon Global High Income Fund which invests in a portfolio of listed and unlisted loan funds, and offers monthly liquidity to investors.
▪ The Barwon Golub Direct Lending Fund which invests into a portfolio of loans managed by Golub Capital, one of the leading specialist middle market corporate lenders.


")
")


 Platform To Digitally Trade Corporate Bonds")


