


From Justin Tyler, Director, Daintree Capital. Please refer to the glossary at the end of the article for a definition of some technical terms.
With inflation concerns rising around the globe, investors need to assess the actual drivers to determine if and how equities might be impacted.
One common question we receive from more conservative investors is: “How long can the equity market performance last?” Of course, it is impossible to be precise, but there is one driver of all markets that we believe is an important indicator – the level of interest rates. Importantly, this does not mean the level of the cash rate set by the RBA. Instead, it is longer maturity bond yields that hold more explanatory power as to the performance of equities and other risk assets.
Bond yields can increase for several different reasons. For example, the future growth backdrop may become more favourable. Expectations for future inflation may pick up as well, either in tandem with, or despite better expectations for growth. Alternatively, the growth or inflation trajectory may become more uncertain, causing fixed income investors to demand a risk premium. Uncertainty with respect to the path of future short-term interest rates might also increase, also giving rise to an increased risk premium being priced into bond yields. A risk premium of this nature is called a term premium, which is essentially a little extra yield to compensate investors for holding longer maturity bonds amid increased levels of uncertainty. Various models exist to help analysts estimate the term premium embedded in nominal bond yields. Note: Most bonds are nominal, the term refers to a bond which makes payments of a fixed amount, rather than a fixed real (inflation-adjusted) value.
The table below summarises the impact that these various components of bond yields have had on equities throughout history.
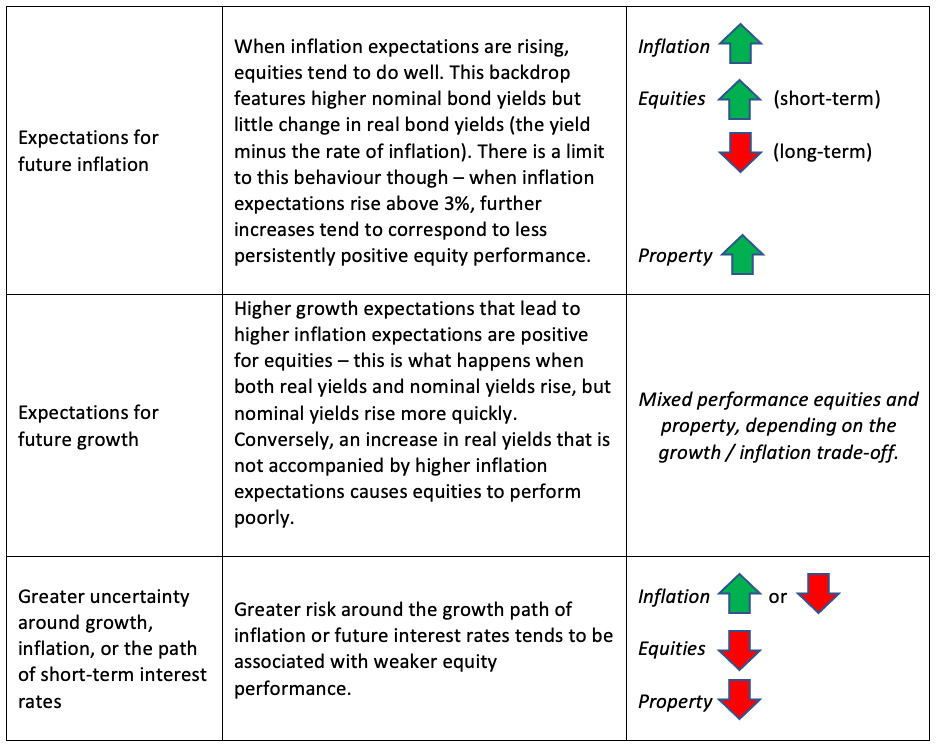
One further point to make is that if components of yields move slowly, then the effect on risk asset valuations tends to be less than if changes in yields happen quickly. We saw an example of this during the February 2021 bond sell-off, which was noteworthy not just in terms of the large move in yields that was seen (50 bp higher in the US 10-year government bond), but also in terms of the short amount of time taken for this move to take place (21 trading days). This velocity in yields was enough to harm equity valuations (the S&P500 was down 4.4% in the period February 12 to March 4).
With these points in mind, it is interesting to consider how vulnerable current risk asset valuations might be to higher bond yields, particularly given the year-on-year gain in the S&P500 to March 2021 was the largest ever recorded. So, how likely are interest rates to spoil the current bull run?
Also read: Australian Economic View – June 2021: Janus Henderson
The chart below shows the rolling three-year volatility of the S&P500 and Daintree’s estimate of how much both real yields and break-even inflation contributed to this series through time. Drivers other than interest rates have been omitted to focus solely on the contribution of 10-year bond rates. For ease of interpretation, we have set these lines to zero unless they are positive.
In the chart, we use a monthly data series of long-term inflation expectations from the University of Michigan survey of US consumers as a proxy for break-even inflation (we use actual break-even inflation after 2009). Nominal yields are represented by Bloomberg generic US 10-year government bond yields, and real yield returns are derived as the duration-matched spread between the two series. We attribute sufficient duration to both yield series such that the unexplained contribution to the standard deviation of the S&P500 is minimised.
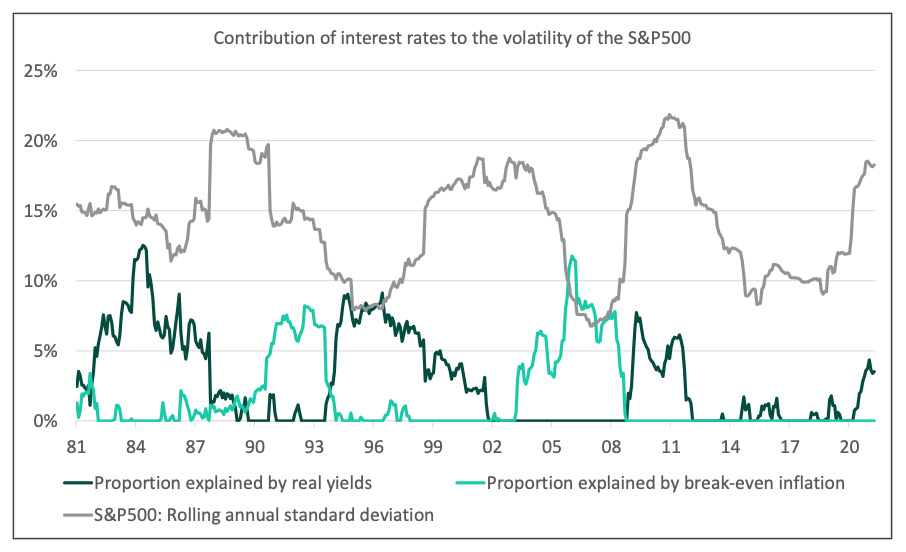
Interestingly, we see alternating cycles – periods where the influence of one component of yields is dominant are followed by periods where the other dominates:
- In the early 1980s equities began a bullish run that ultimately turned out to be secular in nature, lasting until 2000. The 1987 crash, as severe as it was, barely registers on long-term charts today. This equity bull run was initially propelled by real interest rates first peaking in the 1982-1984 period, before beginning a long secular decline that reflected increased central bank credibility.
- The next decade began with a sharp drop in equities in the latter part of 1990, amid fears of higher inflation courtesy of the Gulf War. The subsequent resumption of the move lower in real yields for the rest of the decade coincided with further equity market strength, which was subsequently disrupted by the Asian Financial Crisis, Russian Financial Crisis, the collapse of the technology bubble and the 9/11 attacks.
- The ‘Great Moderation’ after the stock market downturn of 2002 saw the influence of increasing inflation expectations then moved to the foreground, supporting the equity market.
- In 2007 it seemed higher inflation expectations were set to detract from equity returns, but the GFC put paid to this, and the impact of successive waves of quantitative easing pushing real yields lower became the main driver of equities in the early 2010s.
What of the present? The latest data has seen the pandemic and subsequent policy response driving real yields higher at first, as liquidity preference during the initial reaction to the pandemic hurt inflation-linked bonds and risk assets more broadly. Real yields were then pushed lower with expectations bond rates will be low for a very long time, supporting equity valuations.
It remains to be seen whether this cycle follows the historical pattern – will more volatility in real bond yields eventually cause problems for equity valuations? We can say that with real yields now at close to the most negative levels seen in modern history, any future volatility is increasingly likely to be related to an asymmetric move higher in real yields, with negative consequences for equities.
 PODCAST: Defensive Portfolios with Justin Tyler – Director of Daintree Capital
The major uncertainty, however, relates to inflation. Policymakers are creating inflation that is clearly visible in various indicators, perhaps most meaningfully in commodity markets. The increase in the Bloomberg Commodity Index of 48.4% over the year to April 2021 is the largest year-on-year increase in more than 40 years.
The question is – will this price impulse end up manifesting as a period of prolonged price growth across the economy? This might lead to a benign hand-off from lower real yields to higher inflation expectations, with both regimes supporting positive equity market performance. We believe this is the most likely scenario at this point. Inflation is rising from a low base while growth expectations remain high as the recovery from the pandemic continues. This favourable trade-off between growth and inflation has been very good for the performance of equities over the last several months and we expect this dynamic to continue. In fact, real yields may continue to be a driver of positive equity performance for some time, as was the case in the mid-1990s. Inflation will eventually accelerate as companies are forced to pass on increased prices of raw materials, but policymakers have the tools to prevent an uncontrolled increase in inflation.
A risk to this benign view is whether policymakers have the will to use these tools. If policymakers are too permissive of inflation, another possible cycle may play out whereby the favourable trade-off between growth and inflation becomes unfavourable. Inflation expectations would push well above the 3% threshold that has historically been comfortable for equities, while real interest rates would also be pushed higher by increased investor uncertainty. Equity markets would take some time to decipher this, but when it becomes clear that policymakers are tolerating a less benign trade-off between growth and inflation, equity markets will fall accordingly.
Where does this leave investors? Interest rates clearly will not stay low forever, but when they eventually rise the driver is what matters. Inflation expectations can continue to march higher without derailing equity markets, for now. The direction of travel in markets is never smooth though, and so long as the environment for equities and other risk assets remains supportive, investors need to keep an eye on real yields. Deeply negative real yields are one of the main supports for markets right now, but a move higher would be cause for concern.
Glossary
Basis point (bp): One-hundredth of a percent (i.e. 0.01%)
Break-even inflation: The inflation rate that needs to prevail for investors to be indifferent to holding an inflation-linked bond or a nominal bond.
Duration: The valuation of bonds changes with the level of interest rates. For example, if a bond investor buys a bond paying a 1% regular interest payment and tomorrow the yield in the market for this bond increases to 2%, then the bond must re-price lower. This is because the regular 1% payment is now below market rates and is therefore worth less. Duration is the measure of how much a bond’s price will move (in percentage terms) for a given change in the level of bond yields.
Inflation-linked bond: A bond that pays investors a fixed real yield. Investors who hold such a bond until it matures receive this fixed real yield in addition to the realised rate of inflation over the holding period.
Nominal yield: The fixed rate of return that government bond investors receive if they hold a bond until it matures is called the nominal yield. Investors in nominal bonds receive a nominal yield.
Real yield: The real yield is the nominal yield minus the rate of inflation that is expected to prevail over the time to maturity of a bond. For example, if a bond yields 1% while inflation is expected to average 2% over the time until the bond matures, then the real yield is 1% − 2% = −1%.
Term premium: A yield premium to compensate investors for holding longer maturity bonds. Various models exist to help analysts estimate the term premium embedded in nominal bond yields.


")


 Offer Announced")


 Platform To Digitally Trade Corporate Bonds")


