


Global high yield distress ratios have been put in the spotlight by a chart and analysis by Nachu Chockalingam, Senior Credit Portfolio Manager at Federated Hermes.
“For high yield bonds, we define distress as bonds with an OAS (option-adjusted spread) of more than 1,000bp,” Chockalingam said.
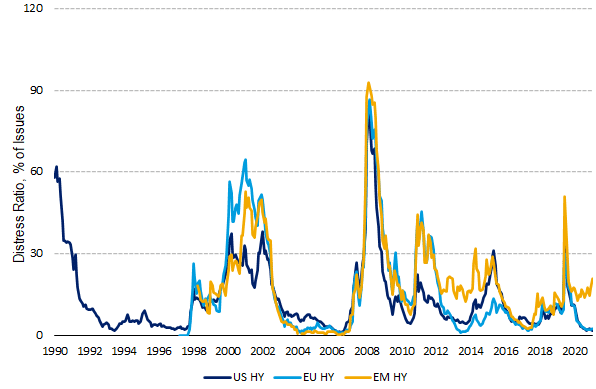
“What is so compelling to see is the dispersion between US and EU high yield vs. EM high yield distress ratios over the past 12 months.
“This has almost exclusively driven by the fallout in Chinese high yield, most notably in the real estate sector.
ALSO READ: Can An Active ETF Strategy Make A Difference? VACF Versus TACT
“As at the end of October, 44% of Asian high yield bonds traded at a “distressed spread” vs. 20.7% for EM high yield as a whole, 2.4% for EU high yield and 1.8% for US high yield.
“This is not that surprising given the fallout of Evergrande in September. In October, we saw another three Chinese developers default (Fantasia Holdings, Modern Land and Xinyuan – the former two because of missed principal payments and the latter because of a distressed exchange).
“Overall, EM default rates now stand at 2.63% and excluding distressed exchanges 1.75%.”


")


 Platform To Digitally Trade Corporate Bonds")


 Prices $US1.25B Bond Raise")